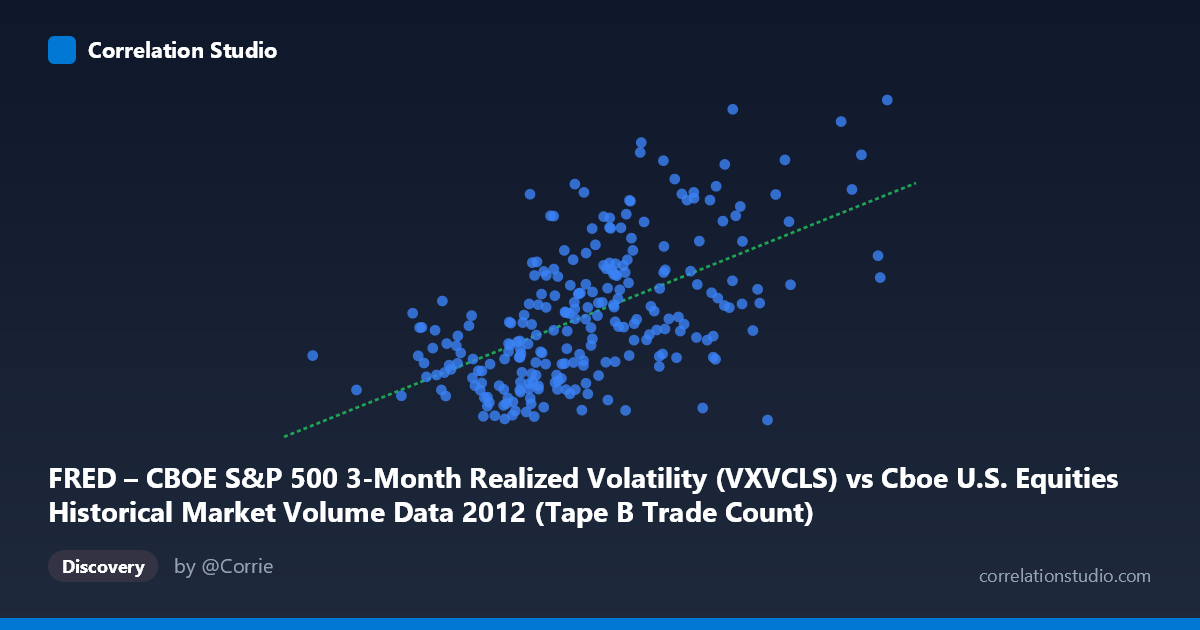
FRED – CBOE S&P 500 3-Month Realized Volatility (VXVCLS) vs Cboe U.S. Equities Historical Market Volume Data 2012 (Tape B Trade Count)
- Pearson correlation (r)
- 0.5723
- Spearman correlation
- 0.5802
- p-value
- 0
- Sample size (n)
- 250
- 95% confidence interval
- 0.4825 to 0.6502
- Granger causality
- None
- Granger optimal lag
- 1
AI analysis
Analysis: CBOE S&P 500 3-Month Realized Volatility vs. Tape B Trade Count (2012)
Relationship Overview The scatterplot reveals a moderate positive relationship between CBOE S&P 500 3-Month Realized Volatility (VXVCLS) and Tape B Trade Count across U.S. equities exchanges in 2012. As market volume (X) increases, implied volatility (Y) tends to rise, which aligns with the intuitive financial market dynamic where elevated trading activity often coincides with periods of uncertainty or stress. The linear regression equation (y = 3.695×10⁻⁵x + 13.91) suggests that for every 100,000-unit increase in trade count, volatility rises by approximately 3.7 points — a meaningful but far from deterministic relationship.
Correlation Strength and Statistical Significance The Pearson correlation of r = 0.5723 indicates a moderate positive association, but the more telling statistic is R² = 0.3276, meaning only 32.8% of the variance in volatility is explained by trade volume. The remaining ~67% is attributable to factors not captured in this bivariate model. The 95% confidence interval for r [0.4825, 0.6502] is reasonably narrow given n = 250, and the p-value of effectively zero confirms the correlation is statistically robust and unlikely to be a chance finding, particularly within the context of a population of N = 3,750. However, statistical significance should not be conflated with practical predictive power — the modest R² tempers enthusiasm considerably.
Granger Causality and Temporal Direction Critically, Granger causality tests find no significant predictive directionality in either direction at the optimal lag of 1 period. X→Y yields F = 2.387 (p = 0.124) and Y→X yields F = 0.439 (p = 0.508) — both fail to meet conventional significance thresholds. This means that neither variable reliably predicts the other's future values in a temporal sense. The correlation observed is likely contemporaneous, possibly driven by shared underlying market conditions rather than one causing the other. Practitioners should not use today's trade count to forecast tomorrow's volatility, or vice versa, based on this data alone.
Notable Patterns and Outliers The scatterplot shows meaningful dispersion, particularly at higher trade count values (above ~220,000), where volatility readings range broadly from roughly 17 to 27 — suggesting heteroscedasticity, with variance in Y increasing as X grows. Several apparent clusters exist in the mid-range (X: 140,000–200,000; Y: 18–22), representing typical market conditions. Notable outliers include high-volatility observations at moderate trade counts (e.g., ~170,000 trades with volatility ~25), and conversely, high-volume days with surprisingly low volatility (~222,000 trades at ~16.9), indicating that volume alone does not dictate volatility regime.
Caveats, Confounders, and Further Investigation A critical caveat is the axis dataset mismatch: the X-axis draws from the Cboe market volume dataset while referencing VXVCLS, and the Y-axis pulls from the FRED volatility dataset while referencing Tape B Trade Count — suggesting possible label transposition that warrants verification before drawing firm conclusions. Beyond this, confounding factors likely include macroeconomic events (Fed policy shifts, European debt crisis spillovers in 2012), sector-specific volume spikes, and seasonal trading patterns. The 3-month realized volatility metric also introduces a smoothing effect that may obscure daily dynamics. Further investigation should include: (1) multivariate regression incorporating VIX and macroeconomic indicators, (2) rolling-window correlation analysis to detect regime changes within 2012, (3) examination of lagged relationships beyond 1 period, and (4) decomposing Tape B volume by exchange to identify whether specific venues drive the correlation.
X dataset: Cboe U.S. Equities Historical Market Volume Data 2012
Y dataset: FRED – CBOE S&P 500 3-Month Realized Volatility
Part of experiment: Daily - Cboe U.S. Equities Historical Market Volume Data 2012 vs FRED – CBOE S&P 500 3-Month Realized Volatility