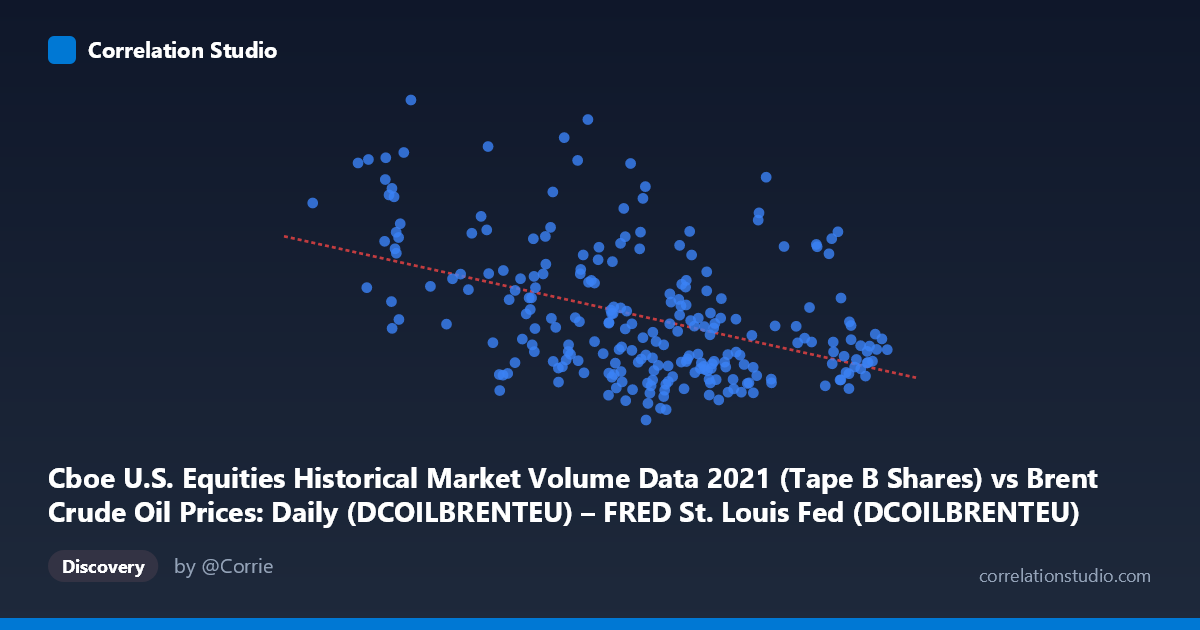
Cboe U.S. Equities Historical Market Volume Data 2021 (Tape B Shares) vs Brent Crude Oil Prices: Daily (DCOILBRENTEU) – FRED St. Louis Fed (DCOILBRENTEU)
- Pearson correlation (r)
- -0.4464
- Spearman correlation
- -0.3975
- p-value
- 0
- Sample size (n)
- 247
- 95% confidence interval
- -0.5411 to -0.3406
- Granger causality
- None
- Granger optimal lag
- 10
AI analysis
Scatterplot Analysis: Brent Crude Oil Price vs. Cboe Tape B Trading Volume (2021)
1. Overall Relationship The visualization plots daily Brent crude oil prices (X-axis, USD/barrel) against Cboe Tape B equity trading volume (Y-axis, shares) across 247 paired observations spanning the full 2021 calendar year. The linear regression equation (y = −1,590,320x + 210,985,000) reveals a negative slope, meaning that as crude oil prices rise, Tape B equity trading volume tends to decline. Visually, the scatterplot shows a loosely downward-trending cloud, but with substantial vertical scatter throughout the entire X-range (~50 to ~86 USD/barrel), suggesting the relationship is real but far from deterministic. The data points form a broad, diffuse band rather than a tight linear cluster, immediately signaling a weak-to-moderate association at best.
2. Correlation Strength, Direction, and Causality The Pearson correlation of r = −0.4464 confirms a moderate negative relationship, but the more practically meaningful figure is r² = 0.1993 — meaning Brent crude oil price explains only about 20% of the variance in Tape B trading volume. Roughly 80% of the day-to-day variation in equity trading volume is driven by other factors entirely. The 95% confidence interval of [−0.5411, −0.3406] is meaningfully bounded away from zero, and the p-value of 1.676 × 10⁻¹³ confirms this correlation is highly statistically significant given the population size of N = 4,788 — the negative relationship is not a sampling artifact. However, the Granger causality tests are uniformly non-significant in both directions (X→Y: F = 0.71, p = 0.71; Y→X: F = 0.72, p = 0.70), even at an optimal lag of 10 periods. This is a critical caveat: despite the statistically significant contemporaneous correlation, neither variable temporally predicts the other. This strongly argues against any simple leading-indicator interpretation and suggests the correlation may be driven by a shared seasonal or macroeconomic rhythm rather than a direct causal mechanism.
3. Notable Patterns, Clusters, and Outliers Several features stand out in the sample data. There is a high-volume cluster at lower oil prices (X ≈ 53–63), where several points reach above 110–166 million shares — consistent with the negative trend. Conversely, in the higher oil price range (X ≈ 78–85), volume observations tend to cluster more tightly in the 70–135 million share range. However, there are notable outliers disrupting the pattern: the point at approximately (70.90, 53,272,852) represents an unusually low-volume day near the mean oil price, while (69.95, 165,546,217) and (66.69, 166,887,528) show anomalously high volume days at moderate prices. These outliers suggest episodic, event-driven trading surges unrelated to oil prices. The mid-range oil price zone (68–75 USD/barrel) — where most observations cluster given the mean of ~70.85 — shows the greatest vertical dispersion, spanning nearly the full Y-range, which inherently weakens the regression fit.
4. Confounding Factors and Interpretive Caveats Several confounding factors limit causal interpretation. Seasonality is a prime candidate: Brent crude prices rose steadily through 2021 as COVID-19 restrictions lifted, while equity trading volumes — which spiked during the 2020–early 2021 retail trading frenzy — may have been independently declining from elevated pandemic-era highs. These two independent trends could produce a spurious negative correlation without any meaningful economic link. Tape B specifically covers regional U.S. exchanges (NYSE American, NYSE Arca, etc.), which may respond to sector-specific or liquidity dynamics unrelated to energy commodities. Additionally, macro confounders — Federal Reserve policy signals, inflation data releases, and earnings seasons — simultaneously affected both crude prices and equity volumes in 2021 without one causing the other. The axes in the dataset description appear transposed in labeling (each dataset's column is attributed to the other), which warrants verification before drawing any firm conclusions.
5. Actionable Insights and Further Investigation Given the modest explained variance and absent Granger causality, practitioners should not use Brent crude prices as a standalone predictor of Tape B volume in any trading or risk model. The relationship is statistically detectable but practically weak. Recommended next steps include: (1) decomposing the time series to remove shared trends and test the correlation on residuals, which would clarify whether the relationship survives detrending; (2) testing against broader market volume metrics (e.g., total consolidated tape volume) to assess whether the relationship is Tape B-specific or market-wide; (3) incorporating multivariate controls such as VIX (volatility), Fed meeting dates, and energy sector ETF flows to isolate any residual crude-volume relationship; and (4) examining sub-period correlations (Q1 vs. Q4 2021) given the dramatic oil price recovery trajectory that year. The non-significant Granger results specifically suggest investing in contemporaneous macro factor models rather than lag-based predictive frameworks.
X dataset: Brent Crude Oil Prices: Daily (DCOILBRENTEU) – FRED St. Louis Fed
Y dataset: Cboe U.S. Equities Historical Market Volume Data 2021
Part of experiment: Daily - Brent Crude Oil Prices: Daily (DCOILBRENTEU) – FRED St. Louis Fed vs Cboe U.S. Equities Historical Market Volume Data 2021