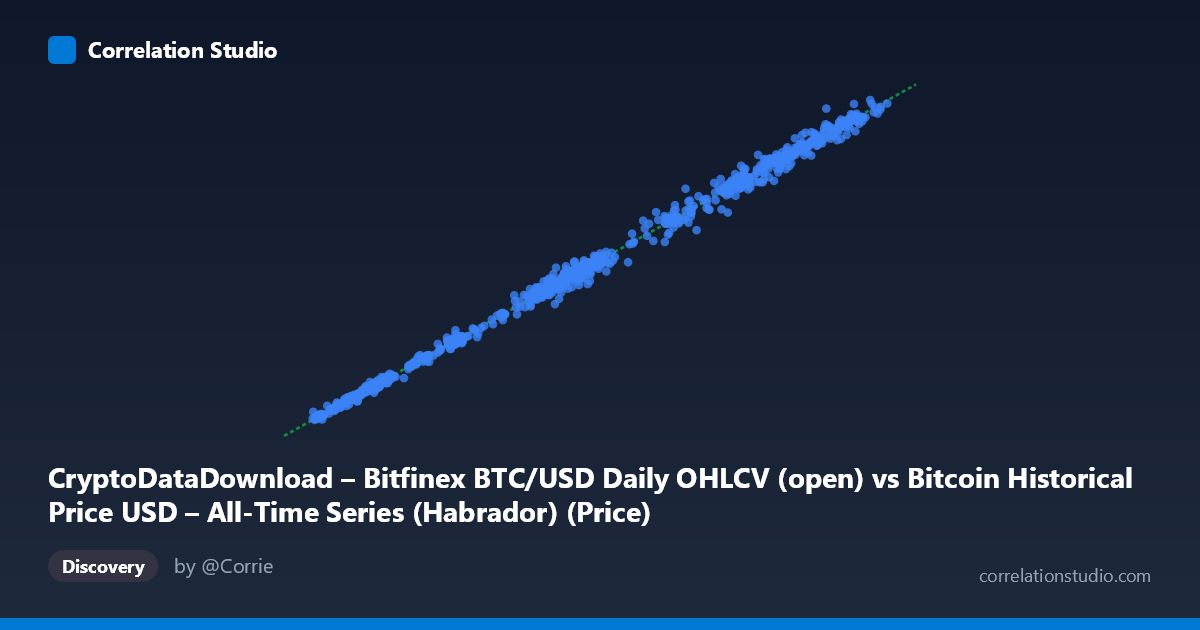
CryptoDataDownload – Bitfinex BTC/USD Daily OHLCV (open) vs Bitcoin Historical Price USD – All-Time Series (Habrador) (Price)
- Pearson correlation (r)
- 0.9988
- Spearman correlation
- 0.9977
- p-value
- 0
- Sample size (n)
- 1103
- 95% confidence interval
- 0.9987 to 0.999
- Granger causality
- None
- Granger optimal lag
- 10
AI analysis
Analysis: BTC/USD Price Correlation (Bitfinex vs. Habrador All-Time Series)
1. What the Visualization Reveals
The scatterplot shows an almost perfectly linear relationship between two Bitcoin price series spanning roughly $15,800 to $124,700. Points hug a near-45° line with slope ≈0.998 and intercept ≈27.4, meaning the two series track each other virtually one-to-one across the entire price range — from bear-market lows near $16,000–$25,000 through bull-market highs above $100,000. There is no visible curvature, fanning, or regime change in the scatter; the tight clustering persists uniformly across low, medium, and high price bands.
2. Strength, Direction, and Statistical Confidence
With r = 0.9988 and r² = 0.9977, roughly 99.8% of the variance in one series is explained by the other — an exceptionally strong positive linear relationship, near the practical ceiling of correlation. The tight 95% CI [0.9987, 0.9990] and p ≈ 0 confirm this isn't a sampling artifact; with n = 1,103 (drawn from a population of 3,902 daily observations over ~3 years), the relationship is statistically rock-solid. However, the Granger causality tests (optimal lag = 10 days) show no significant predictive direction either way (X→Y: p = 0.44; Y→X: p = 0.42). This is a critical distinction: high correlation here reflects contemporaneous co-movement, not a lead-lag relationship where one series forecasts the other. Practically, neither series adds predictive information beyond what's already in the other at any of the tested lags.
3. Notable Patterns and Features
The relationship is essentially linear with no evident outliers, kinks, or heteroscedasticity — even at high price levels ($100,000) where absolute dollar deviations would be expected to grow, the relative tightness holds. Minor point-level deviations exist (e.g., 87,305 vs. 90,446; 61,552.79 vs. 63,001) representing small cross-exchange spread/timing noise, but these are trivial relative to the overall price range and don't constitute meaningful clusters or regime breaks. The slope of 0.998 (essentially 1) and near-zero intercept (27.4, negligible relative to prices in the tens of thousands) indicate the two series are essentially unit-scaled duplicates of each other.
4. Confounding Factors and Caveats
This is a classic case of spurious-by-construction correlation from redundant data sources: both series describe Bitcoin's USD price — one from Bitfinex OHLCV data, the other from a general "all-time series" dataset that likely aggregates or sources from Bitfinex or similar exchanges itself. The high r² doesn't reflect an economic relationship between independent variables; it reflects that both columns are measuring the same underlying asset price through different data pipelines. Key caveats: (1) both series share the same macro drivers (market sentiment, halving cycles, regulatory news), so correlation is definitionally expected; (2) daily OHLCV "open" prices may have minor timestamp/timezone misalignment causing the small residual scatter; (3) the non-significant Granger results likely stem from both series moving simultaneously (same trading day), so no lag structure exists to detect — this is consistent with efficient, arbitrage-linked crypto markets, not with a Granger-testable causal system.
5. Actionable Insights
Given the near-identical nature of these series, this analysis is most useful for data validation/reconciliation rather than economic inference — e.g., confirming that the Habrador dataset's Bitcoin prices are consistent with Bitfinex's own data (residuals from the regression line could flag data entry errors, missing days, or exchange-specific arbitrage gaps). For genuine cross-exchange arbitrage or lead-lag research, finer time resolution (intraday/hourly) and testing shorter lags (1-3 periods) would be more revealing than daily data with a 10-day lag search. If the goal is trading signal generation, this pair offers no edge (no Granger causality); analysts should instead compare BTC/USD across exchanges with genuinely independent liquidity pools (e.g., regional exchanges with capital controls) where basis spreads and lead-lag effects are more likely to exist.
X dataset: Bitcoin Historical Price USD – All-Time Series (Habrador)
Y dataset: CryptoDataDownload – Bitfinex BTC/USD Daily OHLCV
Part of experiment: Bitcoin - Bitcoin Historical Price USD – All-Time Series (Habrador) vs CryptoDataDownload – Bitfinex BTC/USD Daily OHLCV