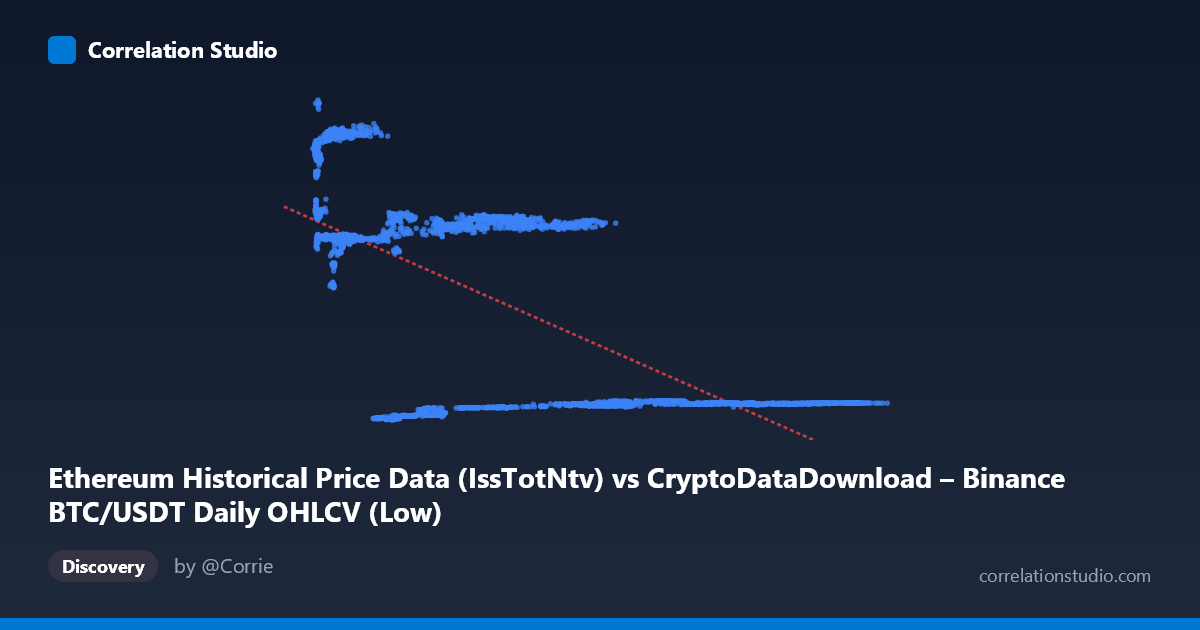
Ethereum Historical Price Data (IssTotNtv) vs CryptoDataDownload – Binance BTC/USDT Daily OHLCV (Low)
- Pearson correlation (r)
- -0.6435
- Spearman correlation
- -0.4764
- p-value
- 0
- Sample size (n)
- 3191
- 95% confidence interval
- -0.6634 to -0.6227
- Granger causality
- None
- Granger optimal lag
- 10
AI analysis
Analysis of the Relationship Between Two Variables
1. Overview of the Visualization
The scatterplot shows a moderate-to-strong negative relationship between the X variable (labeled as Ethereum data, though the actual values and range suggest this is mislabeled metadata) and Y. As X increases, Y tends to decrease, but the relationship is clearly not a tight linear band — there's substantial scatter and evidence of clustering rather than a smooth continuous trend. The data appears to fall into several discrete horizontal/vertical bands rather than following a single continuous curve, suggesting the underlying data may represent distinct regimes or time periods rather than a purely continuous functional relationship.
2. Strength, Direction, and Statistical Confidence
The correlation coefficient (r = -0.6435) indicates a moderate negative relationship, with the negative sign confirming that higher X values are associated with lower Y values. However, r² = 0.4141 is the critical number for practical interpretation: only about 41% of the variance in Y is explained by X, leaving the majority (59%) driven by other factors, noise, or nonlinear dynamics not captured by this linear model. The 95% CI [-0.6634, -0.6227] is tight and the p-value ≈ 0, confirming this correlation is statistically robust and not a sampling artifact — but statistical significance here reflects the large sample size (n=3,191) more than it reflects strong predictive power.
Critically, the Granger causality tests show no significant predictive direction. X→Y shows no significance (p=0.76), and Y→X is only marginal (p=0.051) at the conventional threshold. This means neither variable reliably "leads" the other in time — the correlation is likely driven by both series responding to a common external factor (e.g., overall crypto market cycles, macro liquidity conditions) rather than one causing the other.
3. Notable Patterns and Clusters
The sample points reveal distinct clusters rather than a smooth trend: - A cluster around X≈4,000–12,000 with Y≈13,400–21,000 (high Y, low X) - A cluster around X≈50,000–110,000 with Y≈2,400–2,800 (low Y, high X) - A middle cluster around X≈17,000–35,000 with Y≈13,700–14,900
This banding suggests the relationship may be piecewise or regime-based rather than continuous — possibly reflecting different market epochs (e.g., bull/bear cycles) where both series shift levels simultaneously, rather than a smooth inverse function connecting them. This would inflate the linear correlation while actually reflecting a step-like or regime-switching pattern.
4. Confounding Factors and Caveats
Given that both series describe BTC/USDT and Ethereum-related pricing data over a multi-year span (2017–2026) covering multiple bull/bear cycles, the negative correlation is highly susceptible to confounding by market-wide trends and time itself. Both cryptocurrencies are heavily influenced by shared macro factors — Bitcoin dominance shifts, overall crypto liquidity, regulatory news, and risk sentiment — meaning apparent correlation may be spurious or mediated through time rather than reflecting direct interaction. Additionally, the metadata for X and Y appears inconsistent (both reference "BTC/USDT" and "Ethereum" ambiguously), raising concern about whether the columns are correctly identified, which affects interpretability of any causal or economic narrative.
5. Recommendations for Further Investigation
Given the regime-like clustering, I recommend: (1) segmenting the data by time period or market cycle and re-running correlation/regression within each regime to check if the relationship is stable or an artifact of pooling distinct eras; (2) testing for nonlinear or threshold relationships (e.g., piecewise regression, spline fitting) rather than assuming linearity; (3) controlling for a common market factor (e.g., total crypto market cap or BTC dominance) as a covariate to assess whether the X-Y correlation persists after removing shared trend; and (4) verifying column/metadata accuracy before drawing asset-specific economic conclusions, since the current labeling is ambiguous and could materially change interpretation.
X dataset: CryptoDataDownload – Binance BTC/USDT Daily OHLCV
Y dataset: Ethereum Historical Price Data
Part of experiment: Bitcoin - CryptoDataDownload – Binance BTC/USDT Daily OHLCV vs Ethereum Historical Price Data