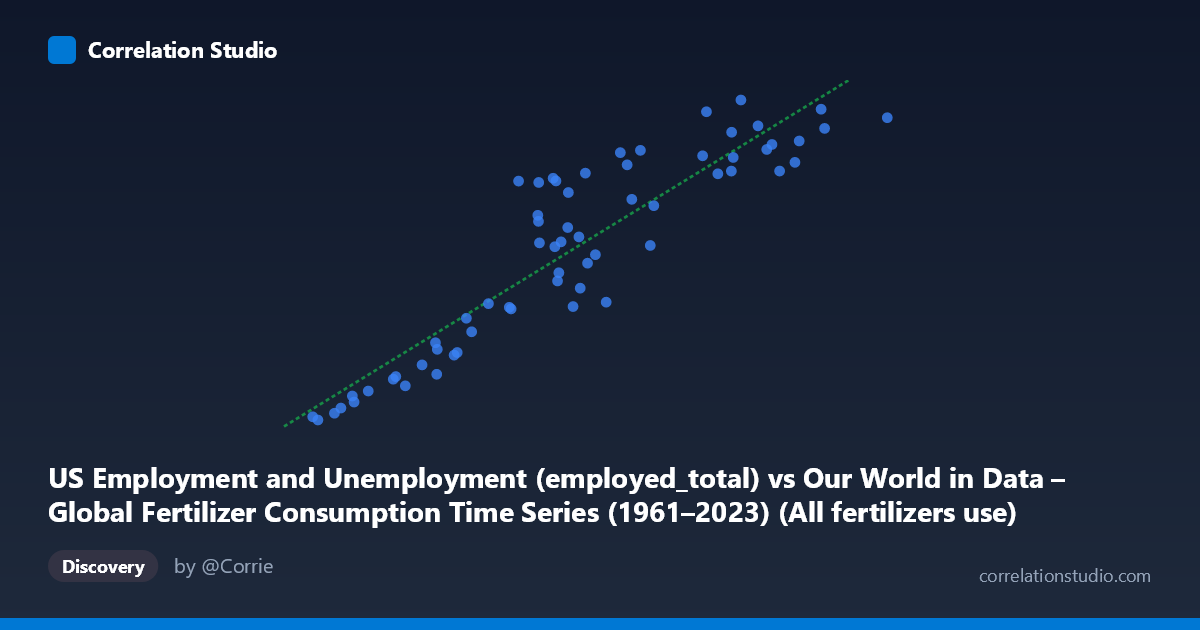
US Employment and Unemployment (employed_total) vs Our World in Data – Global Fertilizer Consumption Time Series (1961–2023) (All fertilizers use)
- Pearson correlation (r)
- 0.9115
- Spearman correlation
- 0.9114
- p-value
- 0
- Sample size (n)
- 63
- 95% confidence interval
- 0.8574 to 0.9457
- Granger causality
- None
- Granger optimal lag
- 10
AI analysis
Analysis: US Total Employment vs. Global Fertilizer Consumption (1961–2023)
Relationship Overview The scatterplot reveals a strong, positive linear relationship between total US employment and global fertilizer consumption over the six-decade period from 1961 to 2023. As US employment figures rise (ranging from roughly 3.2 million to 22.7 million on the x-axis), global fertilizer consumption climbs correspondingly from approximately 65,746 to 161,037 units. The linear regression equation (y = 0.00536x + 52,151) fits the data reasonably well across most of the observed range, with points broadly following the trend line from the lower-left to upper-right of the plot. This visual pattern is consistent with two variables that share a common long-run upward trajectory driven by parallel global development processes over the post-war era.
Correlation Strength and Statistical Interpretation The Pearson correlation of r = 0.9115 is statistically very strong, and the R² of 0.8309 indicates that approximately 83.1% of the variance in global fertilizer consumption is statistically explained by variation in US employment within this sample — a remarkably high figure for two seemingly disparate datasets. The 95% confidence interval of [0.8574, 0.9457] is narrow and entirely positive, confirming the robustness of the association, and the p-value of essentially zero eliminates any possibility this correlation arose by chance in sampling. However, despite this impressive statistical strength, the Granger causality tests tell a critically important story: neither direction achieves significance at the conventional 0.05 threshold (X→Y: F = 2.14, p = 0.050; Y→X: F = 1.92, p = 0.080), even at an optimal lag of 10 periods. This means there is no evidence that either variable temporally predicts the other — the correlation, however strong, does not imply any directional or causal mechanism.
Patterns, Clusters, and Outliers The data exhibits a broadly continuous distribution along the regression line rather than tight clustering, though some notable features emerge. Points at the lower end of the x-axis (US employment ~3–6 million, fertilizer ~65,000–85,000) form a relatively tight cluster corresponding to the early 1960s period. In the mid-range (employment ~10–14 million), there is noticeably greater vertical scatter, with fertilizer values spanning roughly 99,000 to 146,000 for similar employment levels — suggesting that the linear relationship weakens somewhat in this intermediate zone and that additional variables modulate fertilizer consumption independently of employment. A few points in the upper range (employment 18 million) appear slightly below the regression line, and the extreme upper-right observations (e.g., 22.7M employment, 155,761 fertilizer) anchor the high end. No extreme outliers are visually apparent, but the mid-range dispersion hints at possible non-linearity or structural breaks.
Confounding Factors and Caveats This correlation is almost certainly a spurious long-run trend correlation — a classic pitfall in time-series analysis. Both US employment and global fertilizer consumption are strongly trended upward over 1961–2023 due to entirely independent causes: US employment growth reflects population expansion, labor force participation changes, and economic development, while global fertilizer consumption growth reflects the Green Revolution, expanding agricultural land, and rising global food demand. Any two variables sharing a common upward secular trend across 60+ years will tend to correlate highly without any meaningful causal connection. The mislabeled axes (the dataset notes suggest the x/y variable labels may be swapped between datasets) further complicate substantive interpretation. Additionally, global fertilizer data aggregates across all countries, while employment is US-specific — comparing a national labor metric to a global agricultural metric introduces fundamental scope mismatch.
Actionable Insights and Further Investigation Given the absence of Granger causality and the likely spurious nature of the correlation, no direct policy or predictive inference should be drawn between these variables as presented. Researchers should first verify the axis labeling and dataset alignment, as the metadata descriptions appear to be inverted. To meaningfully investigate fertilizer consumption drivers, analysts should instead examine variables such as global population, cropland area, food price indices, or regional agricultural policy changes. For US employment analysis, sector-specific employment (particularly agricultural employment) would be a more theoretically motivated pairing. Statistically, co-integration testing (e.g., Engle-Granger or Johansen tests) and detrending both series before correlation analysis would reveal whether any relationship persists beyond the shared time trend — and would likely substantially reduce the observed r value, providing a more honest picture of the true underlying association.
X dataset: Our World in Data – Global Fertilizer Consumption Time Series (1961–2023)
Y dataset: US Employment and Unemployment
Part of experiment: Yearly - Our World in Data – Global Fertilizer Consumption Time Series (1961–2023) vs US Employment and Unemployment