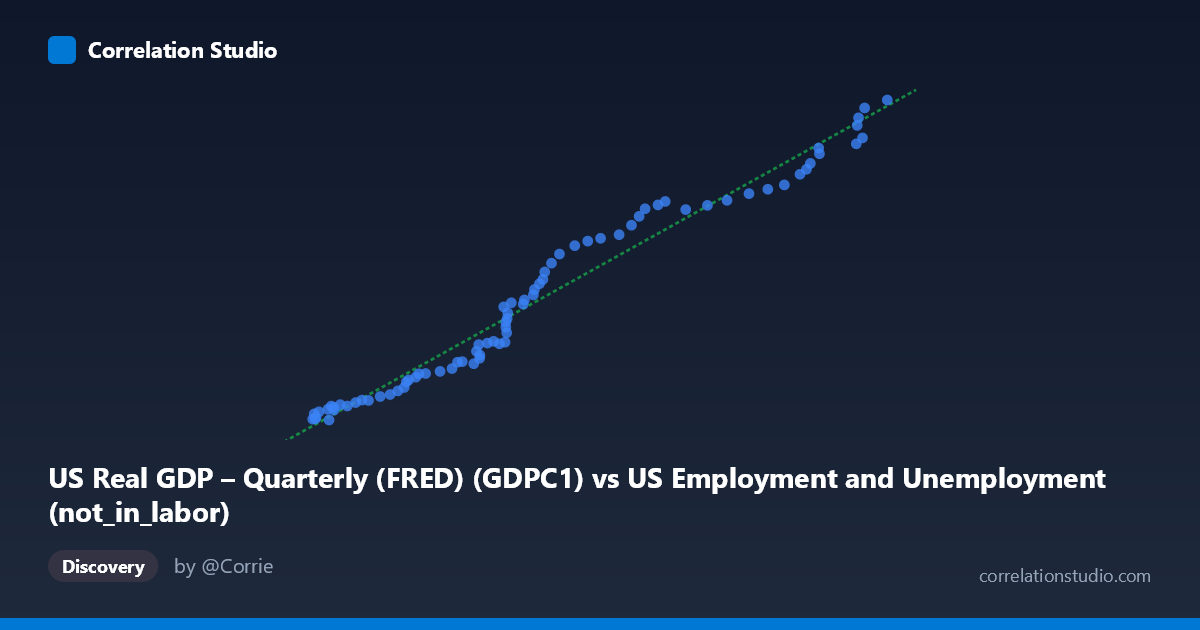
US Real GDP – Quarterly (FRED) (GDPC1) vs US Employment and Unemployment (not_in_labor)
- Pearson correlation (r)
- 0.9848
- Spearman correlation
- 0.9978
- p-value
- 0
- Sample size (n)
- 79
- 95% confidence interval
- 0.9762 to 0.9903
- Granger causality
- None
- Granger optimal lag
- 10
- Time coverage
- 1947-01-01 to 2025-01-01
- Recomputed on refreshed data
- 2026-10-09 (r was 0.9847)
AI analysis
Analysis: US Real GDP vs. Not in Labor Force
Relationship Overview
The scatterplot reveals a remarkably strong positive relationship between US Real GDP (quarterly, in billions of chained 2017 dollars) and the number of Americans not in the labor force. As GDP rises from roughly $42,000B to $103,000B across the observation window (1947–2025), the not-in-labor-force population climbs from approximately 2,183 to 23,548 (thousands or comparable units). The linear regression equation y = 0.355x − 13,280 fits the data visibly well, with data points tracking closely along the regression line across nearly the entire range. This is a striking visual result: two variables that might intuitively seem oppositional — economic output and labor force non-participation — are in fact moving together over this long historical arc.
Correlation Strength and Statistical Interpretation
The correlation is exceptionally strong at r = 0.9847, with R² = 0.9697, meaning approximately 97% of the variance in labor force non-participation is statistically explained by variation in Real GDP. The 95% confidence interval [0.9762, 0.9902] is narrow and entirely in high-positive territory, reflecting high precision in this estimate, and the p-value of effectively zero confirms this is not a chance finding across the n=79 paired observations. However, the Granger causality tests complicate any causal interpretation: neither direction (X→Y nor Y→X) reaches significance (F=0.622, p=0.787 and F=0.736, p=0.687 respectively, even at optimal lag=10 periods). This means that while the two variables are tightly correlated, neither reliably predicts the other temporally beyond what a shared trend already explains — a critical caveat against inferring any directional economic mechanism from this correlation alone.
Patterns, Clusters, and Notable Features
The data exhibits a smooth, nearly monotonic progression consistent with two long-run time trends growing together over nearly eight decades. There is mild visual evidence of slight curvature at the upper end (GDP $90,000B), where a few points — particularly those near (100,465; 23,082) and (102,846; 23,548) — appear to pull slightly above the linear fit, hinting at possible acceleration in non-participation at very high GDP levels (plausibly reflecting post-2008 or post-COVID structural shifts in labor force attachment). The lower cluster (GDP < $55,000B) is tight and well-behaved. No dramatic outliers are present, but the densest cluster appears in the $60,000–$70,000B GDP range, reflecting the extended period the US economy spent in that output zone, which may give the regression disproportionate anchoring influence in that region.
Confounding Factors and Interpretive Caveats
This correlation is almost certainly driven by shared secular time trends rather than a direct structural relationship. Both Real GDP and the not-in-labor-force population have grown over 75+ years due to entirely independent forces: GDP through productivity growth, capital accumulation, and population expansion; non-participation through aging Baby Boomers, rising educational enrollment, early retirement trends, disability rates, and shifts in female labor force participation. This is a textbook case of spurious correlation via common time trend — the very thing Granger causality testing is designed to expose, which it does here by finding no temporal predictive relationship in either direction. Additionally, mixing quarterly GDP data with what appears to be annual employment data introduces temporal resolution mismatches that may smooth over cyclical dynamics. The long time coverage (1947–2025) also spans dramatically different macroeconomic regimes, making a single linear model potentially misleading.
Actionable Insights and Further Investigation
Rather than treating this correlation as substantively meaningful on its own, the appropriate next steps are to detrend both series (e.g., via first-differencing or HP filter) and re-examine whether any relationship persists after removing the shared time trend — the expectation being that much of the r=0.985 would dissolve. It would also be valuable to segment the data by era (pre/post-1980, pre/post-2008, pre/post-COVID) to test whether structural breaks exist, and to investigate whether GDP growth rate (rather than GDP level) correlates negatively with non-participation as economic theory would suggest. Cross-referencing with unemployment rates, demographic age-structure data, and disability insurance enrollment would help disentangle the true drivers of non-participation trends from any cyclically responsive component tied to economic conditions.
X dataset: US Employment and Unemployment
Y dataset: US Real GDP – Quarterly (FRED)
Part of experiment: Yearly - US Employment and Unemployment vs US Real GDP – Quarterly (FRED)