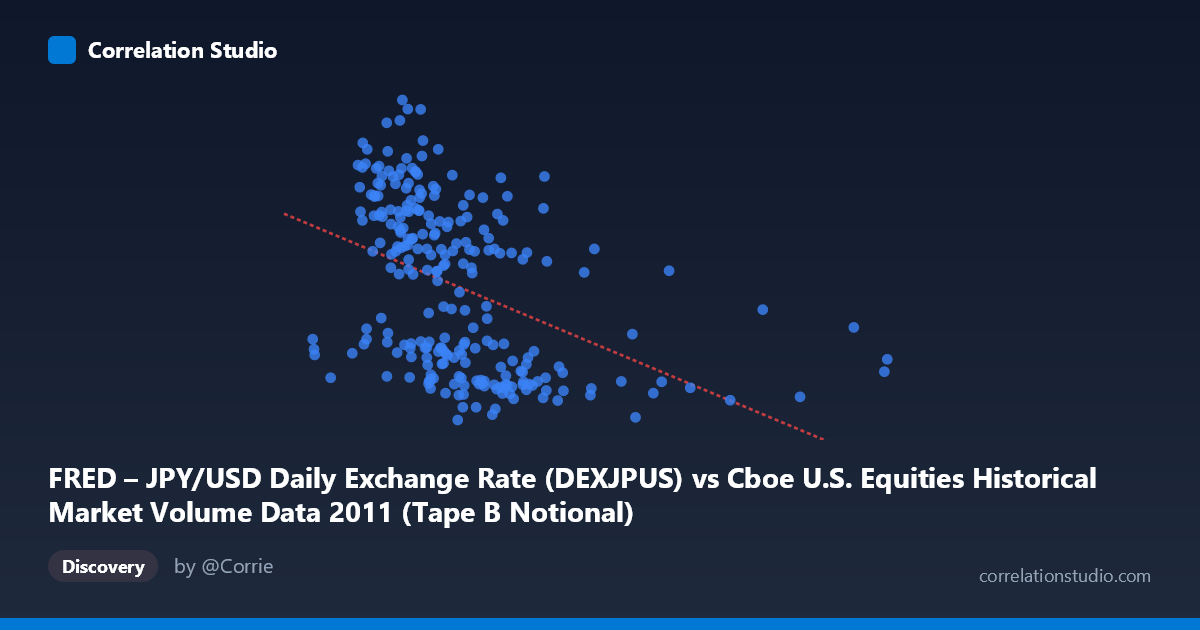
FRED – JPY/USD Daily Exchange Rate (DEXJPUS) vs Cboe U.S. Equities Historical Market Volume Data 2011 (Tape B Notional)
- Pearson correlation (r)
- -0.4311
- Spearman correlation
- -0.5597
- p-value
- 0
- Sample size (n)
- 250
- 95% confidence interval
- -0.527 to -0.3244
- Granger causality
- None
- Granger optimal lag
- 1
AI analysis
Scatterplot Analysis: JPY/USD Exchange Rate vs. Cboe U.S. Equities Market Volume (2011)
1. Overall Relationship Revealed by the Visualization
The scatterplot displays a modest negative relationship between U.S. equities market trading volume (X-axis, measured in notional value) and the JPY/USD exchange rate (Y-axis, measured in yen per dollar). As trading volume increases — particularly beyond roughly 6–7 billion — the yen-per-dollar rate tends to cluster at lower values (roughly 76–78 yen/USD), while higher yen-per-dollar values (82–85+) are predominantly associated with lower trading volumes (below ~5 billion). The linear regression line (y = −5.975×10⁻¹⁰x + 82.75) captures a gentle downward slope, but the wide scatter around that line makes clear that volume alone explains only a fraction of exchange rate behavior.
2. Correlation Strength, Direction, and Statistical Meaning
The Pearson r of −0.431 indicates a moderate negative correlation, though the explanatory power is decidedly limited: r² = 0.186, meaning that trading volume accounts for only ~18.6% of the variance in the JPY/USD rate over this period. The remaining ~81% is driven by other forces entirely unrelated to this single predictor. The 95% confidence interval of [−0.527, −0.324] is meaningfully away from zero and entirely negative, suggesting the direction of the relationship is reliable — it is not a statistical artifact of the sample. The p-value of 9.71×10⁻¹³ confirms the correlation is highly statistically significant given n = 250 paired observations drawn from a population of N = 3,780. However, statistical significance here reflects the precision of our estimate, not the practical magnitude of the effect — a weak-to-moderate relationship remains weak-to-moderate regardless of how confidently we measure it. Critically, the Granger causality tests yield no significant directional predictive relationship in either direction (X→Y: F = 0.086, p = 0.769; Y→X: F = 0.045, p = 0.832). This means that past values of equity volume do not help forecast future JPY/USD rates, and vice versa — the correlation is contemporaneous and associative rather than temporally predictive.
3. Notable Patterns, Clusters, Outliers, and Non-Linearity
Several structural features stand out in the data. There is a visible clustering of high-Y (JPY/USD ~82–85) values at relatively low X values (~3–5 billion), most likely reflecting the early-to-mid 2011 period when the yen was exceptionally strong following the March Tōhoku earthquake and subsequent safe-haven flows. Conversely, a dense cluster of low-Y values (76–78 yen/USD) appears across a wide range of X values, forming a horizontal band that dominates the right half of the chart. Two notable outliers on the far right — including the maximum X value of ~14.1 billion and another near ~11.5 billion — show moderate Y values (~77–79), suggesting high-volume days did not necessarily coincide with extreme exchange rate movements. The note that Spearman ρ exceeds Pearson r is important: this implies the true relationship may be better described by a monotonic but non-linear function, such as a logarithmic or polynomial fit, rather than a straight line. The regression line likely understates the relationship at low-volume/high-yen values and overstates it in the mid-range.
4. Confounding Factors and Interpretive Caveats
Interpreting this correlation causally would be inappropriate for several reasons. 2011 was a historically anomalous year for both variables: the Tōhoku earthquake and tsunami (March 11), the Fukushima nuclear disaster, the European sovereign debt crisis, and subsequent Bank of Japan interventions to weaken the yen all created discrete structural breaks in the JPY/USD series. These macro-events simultaneously affected risk appetite (influencing U.S. equity trading volume) and currency flows — making them powerful common-cause confounders. Additionally, U.S. equities volume is influenced by domestic factors (Fed policy, U.S. corporate earnings cycles, Dodd-Frank implementation) that have no direct transmission mechanism to yen pricing. The temporal mismatch between datasets (daily exchange rates from FRED paired with daily U.S. equity volume from Cboe) introduces potential measurement timing issues. The cross-dataset pairing also means this correlation may be spurious — two time series co-moving within the same calendar year due to shared macroeconomic background rather than any direct economic linkage.
5. Actionable Insights and Further Investigation
Given the moderate correlation but absent Granger causality, the most productive next steps would be: (1) Test a logarithmic or polynomial regression to better capture the apparent non-linearity flagged by the Spearman/Pearson divergence — this may improve variance explained beyond 18.6%. (2) Segment the data by known structural breaks (pre/post March 11, 2011) to determine whether the correlation is driven primarily by the earthquake-period anomaly; if so, the relationship in "normal" periods may be far weaker or disappear entirely. (3) Introduce control variables — particularly VIX (equity volatility), U.S. Treasury yields, and BOJ intervention dates — to partial out the confounding macro environment and test whether a residual relationship survives. (4) Extend the time series beyond 2011 to assess whether this correlation is structurally persistent or a one-year artifact. (5) Examine sector-specific volume (e.g., financial sector equities) which may have a theoretically stronger linkage to currency markets than aggregate Cboe volume. The absence of Granger causality effectively rules out a simple trading-signal application, but the contemporaneous association warrants deeper structural modeling before being dismissed entirely.
X dataset: Cboe U.S. Equities Historical Market Volume Data 2011
Y dataset: FRED – JPY/USD Daily Exchange Rate
Part of experiment: Daily - Cboe U.S. Equities Historical Market Volume Data 2011 vs FRED – JPY/USD Daily Exchange Rate