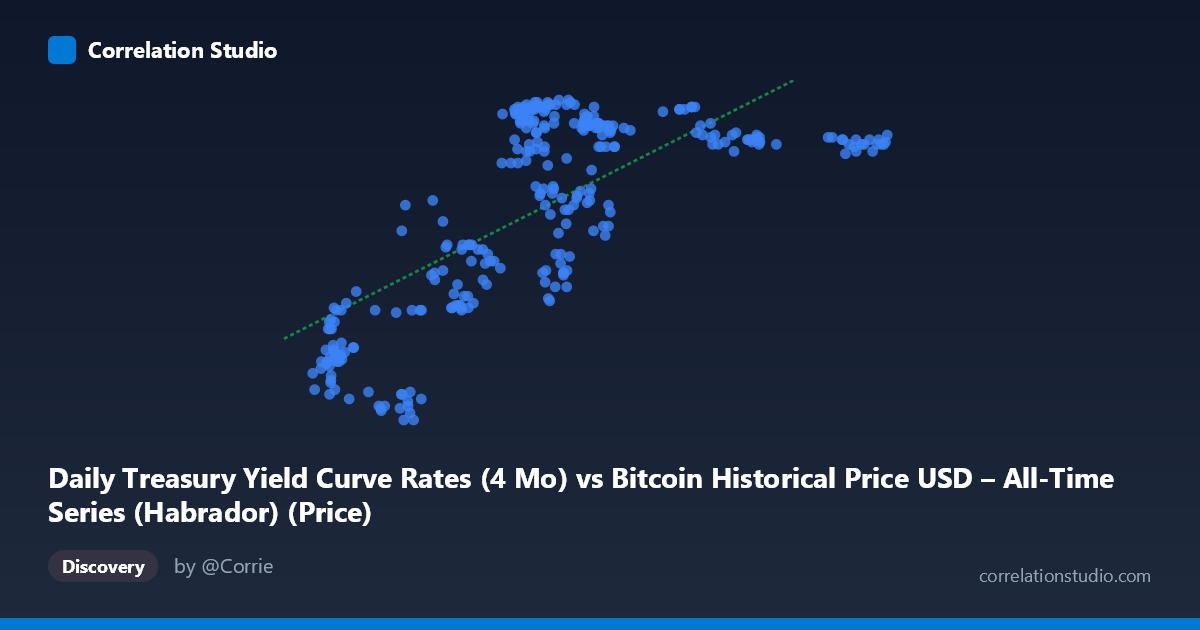
Daily Treasury Yield Curve Rates (4 Mo) vs Bitcoin Historical Price USD – All-Time Series (Habrador) (Price)
- Pearson correlation (r)
- 0.7134
- Spearman correlation
- 0.6226
- p-value
- 0
- Sample size (n)
- 300
- 95% confidence interval
- 0.6529 to 0.7649
- Granger causality
- None
- Granger optimal lag
- 1
- Time coverage
- 2022-10-19 to 2023-12-29
- Recomputed on refreshed data
- 2026-10-24 (r was 0.7134)
AI analysis
Analysis: Treasury Yield (4-Mo) vs. Bitcoin Price
Note on axis labeling: The axis labels appear swapped in the metadata (X is labeled as Treasury yield but contains Bitcoin-scale values like 15,787–44,166; Y is labeled as Bitcoin price but contains values in the 4.27–5.64 range, consistent with a yield percentage). This analysis treats X as Bitcoin price (USD) and Y as the 4-Month Treasury yield (%), which matches the actual data ranges shown.
1. What the Visualization Reveals
The scatterplot shows a clear positive, moderately strong relationship: as Bitcoin's price rose through late 2022 into 2023, the 4-month Treasury yield also climbed — consistent with the Fed's aggressive rate-hiking cycle during this period. Rather than a tight linear band, the data shows a somewhat stepped or clustered pattern, suggesting yields moved in discrete policy-driven increments (FOMC meeting jumps) while Bitcoin price moved more continuously within each yield "band."
2. Strength, Direction, and Statistical Confidence
The correlation coefficient (r = 0.713) indicates a moderately strong positive linear relationship, with r² = 0.509 meaning Bitcoin's price explains roughly 51% of the variance in the 4-month yield — leaving nearly half unexplained by this single variable. The 95% CI [0.653, 0.765] is reasonably tight given n=300, and the p-value ≈ 0 confirms this correlation is highly unlikely to be due to chance. However, correlation ≠ causation, and the Granger causality tests reinforce this: neither direction shows significant predictive power (X→Y: p=0.47; Y→X: p=0.074, only marginally suggestive). This means past Bitcoin prices don't reliably forecast future yields, nor vice versa — the relationship is likely driven by both variables responding to a common underlying macro regime (Fed tightening cycle, risk-on/risk-off sentiment) rather than one causing the other.
3. Notable Patterns and Features
The data shows visible clustering: a low-price/low-yield cluster (~$16-24K, ~4.3-4.8%) corresponding to late 2022, and a high-price/high-yield cluster (~$26-30K, ~5.2-5.6%) corresponding to early-to-mid 2023, with a sparser tail extending to $42-44K at yields plateauing near 5.4-5.5%. This plateau at the high end is notable — it suggests yields saturated (as the Fed paused hikes near a terminal rate) even as Bitcoin continued to climb, indicating a non-linear, flattening relationship at higher price levels rather than a strictly proportional one.
4. Confounding Factors and Caveats
This relationship is almost certainly confounded by time itself — both series trended over the same 14-month window (Oct 2022–Dec 2023), a period dominated by a single macro narrative (Fed rate hikes, then pause, alongside a Bitcoin recovery rally). This is a classic case of spurious-like correlation via a shared time trend: two non-stationary series drifting in the same direction don't necessarily have a direct economic link. The N=5,764 vs. n=300 sampling gap also warrants scrutiny — ensure the 300-point sample isn't systematically biased toward certain sub-periods.
5. Suggestions for Further Investigation
Given the lack of Granger causality, avoid using this correlation for predictive trading signals. Instead: (1) detrend or difference both series (e.g., analyze % changes rather than levels) to test if a genuine relationship survives after removing the shared time trend; (2) run a multivariate model including other macro variables (DXY, real rates, equity indices) to isolate Bitcoin's independent sensitivity to yields; (3) segment the analysis by Fed policy regime (hiking vs. pause) to check if the relationship holds or breaks down, since the plateau pattern suggests regime-dependent behavior.
X dataset: Bitcoin Historical Price USD – All-Time Series (Habrador)
Y dataset: Daily Treasury Yield Curve Rates
Part of experiment: Bitcoin - Bitcoin Historical Price USD – All-Time Series (Habrador) vs Daily Treasury Yield Curve Rates