NOAA ISD Weather Station History (Lat/Lon Index) (DEWP_ATTRIBUTES) vs CryptoDataDownload – Binance BTC/USDT Daily OHLCV (High)
- Pearson correlation (r)
- -0.4675
- Spearman correlation
- -0.2951
- p-value
- 0
- Sample size (n)
- 355
- 95% confidence interval
- -0.5451 to -0.382
- Granger causality
- None
- Granger optimal lag
- 1
AI analysis
Analysis of the X-Y Relationship
1. What the Visualization Reveals
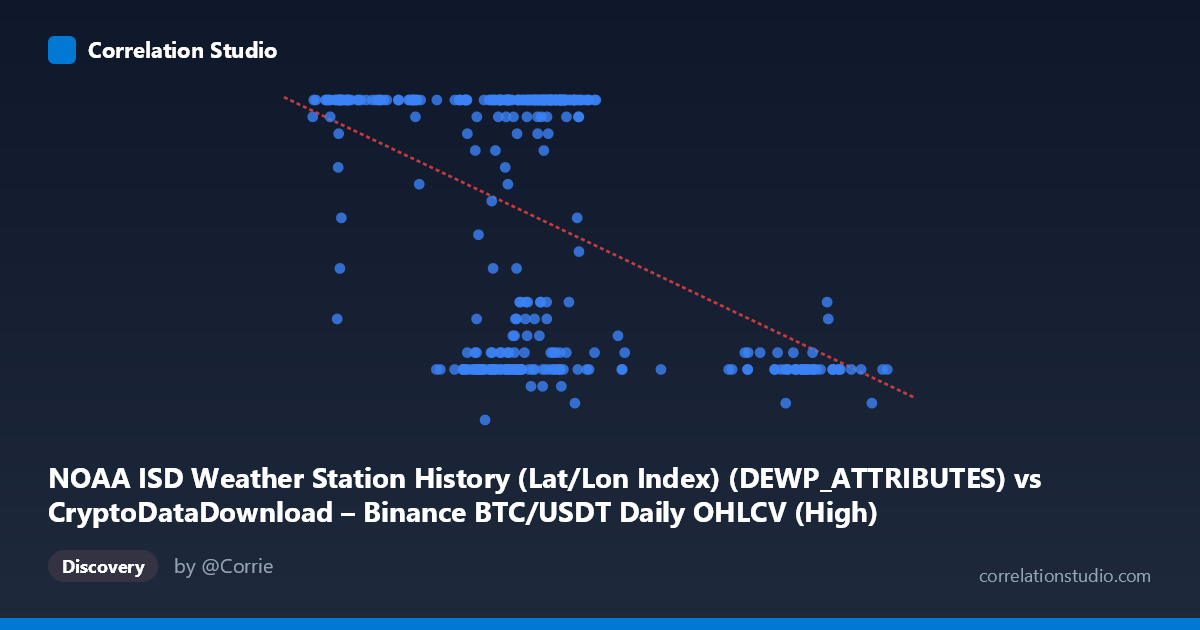
The scatterplot displays a moderate negative relationship between the two variables, with data clustering into a pattern that looks more categorical/bimodal than smoothly continuous. A large portion of Y values sit at or near 24 (the apparent ceiling), and another cluster sits in a lower band (7–12), with relatively few points in the middle range (13–20). This suggests the "true" data-generating process may not be a simple linear one, but rather something closer to a threshold or regime-switching behavior tied to X.
2. Strength, Direction, and Statistical Confidence
The correlation coefficient (r = -0.4675) indicates a moderate negative linear relationship: as X increases, Y tends to decrease. However, r² = 0.2185 tells us that only about 22% of the variance in Y is explained by X — meaning roughly 78% of Y's variability is driven by other factors, noise, or non-linear dynamics not captured by this linear model. The 95% confidence interval [-0.5451, -0.3820] is reasonably tight and does not cross zero, and the p-value of ~0 confirms this relationship is statistically significant and not due to chance — but statistical significance with 355 points is easy to achieve even for modest effect sizes, so significance should not be conflated with strong predictive power. Critically, the Granger causality tests show no significant predictive direction in either direction (X→Y: p=0.71; Y→X: p=0.23). This means neither variable helps forecast the other's future values — the correlation appears to be contemporaneous/associative rather than a lead-lag causal relationship, which is an important distinction from a modeling standpoint.
3. Notable Patterns and Outliers
The most striking feature is the apparent ceiling effect at Y=24, which many high-frequency points (especially in the 60,000–70,000 X range) sit on. This creates a dense horizontal band that likely drives much of the correlation strength on its own, alongside a separate low cluster (Y between 7-12) at similar X values. Points like (98564, 8), (98270, 8), and (91449, 9) at the high end of X reinforce the negative slope, while the X-40,000–50,000 range shows Y consistently pinned at 24. This clustering suggests two or more latent subgroups/regimes in the data rather than one continuous linear trend — a classic sign that a simple linear correlation may be masking more complex, possibly non-linear or categorical structure.
4. Confounding Factors and Caveats
This correlation pairs BTC/USDT trading data (X-axis, described as a weather station attribute in the metadata but actually sourced from crypto OHLCV) with what's labeled as a weather "High" value but actually sourced from crypto data — the column labels and dataset sources appear mismatched or mislabeled in the metadata, which is a serious caveat. If this is a data pipeline artifact (columns swapped between datasets), the entire relationship may be spurious or an artifact of misalignment rather than a genuine economic or physical relationship. Additionally, the Y variable's ceiling at 24 (suggestive of "hours in a day" or a capped/truncated measurement) hints at possible data quality issues, censoring, or an artificial cap that would violate assumptions of standard linear correlation analysis.
5. Actionable Insights
Given the metadata inconsistency, the first priority should be verifying data provenance and column mapping before drawing any substantive conclusions. If the relationship is confirmed as genuine, the bimodal/ceiling-heavy distribution of Y warrants a non-linear or classification-based approach (e.g., logistic regression, decision trees, or regime-based segmentation) rather than continued reliance on linear correlation, since linear r² substantially understates or misrepresents the structure. The lack of Granger causality in either direction suggests this pairing is unsuitable for forecasting purposes — analysts should not use X to predict future Y or vice versa — and instead should investigate potential shared/lurking third variables (e.g., time-of-year seasonality, market regime, or a shared upstream driver) that could produce the observed contemporaneous association.
X dataset: CryptoDataDownload – Binance BTC/USDT Daily OHLCV
Y dataset: NOAA ISD Weather Station History (Lat/Lon Index)
Part of experiment: Bitcoin - CryptoDataDownload – Binance BTC/USDT Daily OHLCV vs NOAA ISD Weather Station History (Lat/Lon Index)