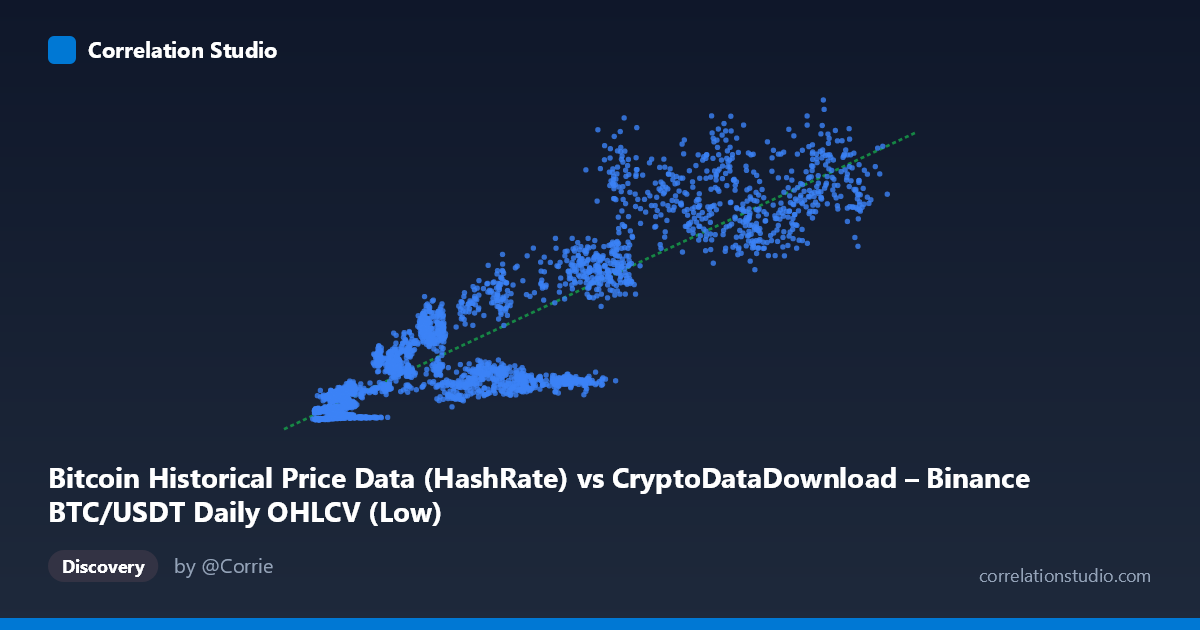
Bitcoin Historical Price Data (HashRate) vs CryptoDataDownload – Binance BTC/USDT Daily OHLCV (Low)
- Pearson correlation (r)
- 0.8933
- Spearman correlation
- 0.8842
- p-value
- 0
- Sample size (n)
- 3191
- 95% confidence interval
- 0.8861 to 0.9001
- Granger causality
- None
- Granger optimal lag
- 10
- Time coverage
- 2017-08-17 to 2026-05-20
AI analysis
Analysis: Bitcoin Hash Rate vs. Price Relationship
1. What the Visualization Reveals
The scatterplot depicts a strong positive relationship between Bitcoin's network hash rate (X-axis) and its price, measured via the daily low (Y-axis). As hash rate increases from roughly 2,800 to 123,000 (units implied by the dataset), price rises from single-digit millions to over 1.3 billion in the underlying scale. The relationship is not perfectly linear — it exhibits an accelerating, convex pattern where price grows disproportionately faster at higher hash rate levels, consistent with the exponential-like growth typical of Bitcoin's price history rather than a strict straight-line trend.
2. Strength, Direction, and Predictive Direction
The correlation coefficient (r = 0.893) indicates a strong positive linear relationship, and r² = 0.798 tells us that roughly 80% of the variance in Y (price) is statistically explained by X (hash rate) under a linear model — a substantial but not complete explanatory power, leaving ~20% of variance driven by other factors. The 95% confidence interval [0.886, 0.900] is tight, and the p-value of ~0 confirms this correlation is highly statistically significant and not due to chance, given the large sample (n=3,191).
However, the Granger causality tests reveal an important nuance: neither variable significantly predicts the other in a temporal/lead-lag sense (X→Y: p=0.49; Y→X: p=0.19). This means that despite the strong contemporaneous correlation, hash rate changes today do not reliably forecast future price movements, and vice versa. This is a critical distinction — correlation here reflects a shared trend or co-movement over time, not a causal, predictive mechanism in either direction at the tested lag structure (10 periods).
3. Notable Patterns and Features
The data shows a clustering pattern rather than a smooth continuum: low hash rate values (under 15,000) cluster tightly with low prices (under ~150M), while higher hash rate values (60,000+) show much greater price dispersion — e.g., at similar hash rates near 60,000–65,000, prices range widely from ~150M to over 1 billion. This heteroscedasticity (increasing variance at higher X values) suggests the relationship isn't uniform across the range and that other factors increasingly influence price as the network matures. The overall shape hints at a power-law or exponential curve rather than a strict linear fit, even though linear regression still captures ~80% of variance.
4. Confounding Factors and Caveats
Both hash rate and price likely share a common underlying driver: overall Bitcoin network growth, adoption, and market cycles over the 2017–2026 period. This makes the relationship likely spurious in a causal sense — both variables are trending upward over time due to Bitcoin's broader adoption curve, not because one directly drives the other. Miners increase hash rate in response to expected profitability (a forward-looking, not lagged, response), while price is driven by speculative demand, macroeconomic conditions, and adoption — factors hash rate doesn't capture. The lack of Granger causality reinforces that this is likely a case of two trending time series that are correlated due to a shared time-based trend (non-stationarity), a classic pitfall in time-series correlation analysis.
5. Actionable Insights
Given the non-stationary, trending nature of both series, analysts should test for cointegration rather than relying solely on simple correlation/Granger tests on raw levels — differencing or de-trending the series (e.g., using log returns or percentage changes) would clarify whether short-term hash rate changes have any predictive power over price changes. Further investigation should also explore third-variable confounders (network adoption metrics, exchange volume, regulatory events) and consider non-linear regression models (log-log or power-law fits) given the visible curvature, which may improve explanatory power beyond the current 79.8% linear R².
X dataset: CryptoDataDownload – Binance BTC/USDT Daily OHLCV
Y dataset: Bitcoin Historical Price Data
Part of experiment: Bitcoin - CryptoDataDownload – Binance BTC/USDT Daily OHLCV vs Bitcoin Historical Price Data