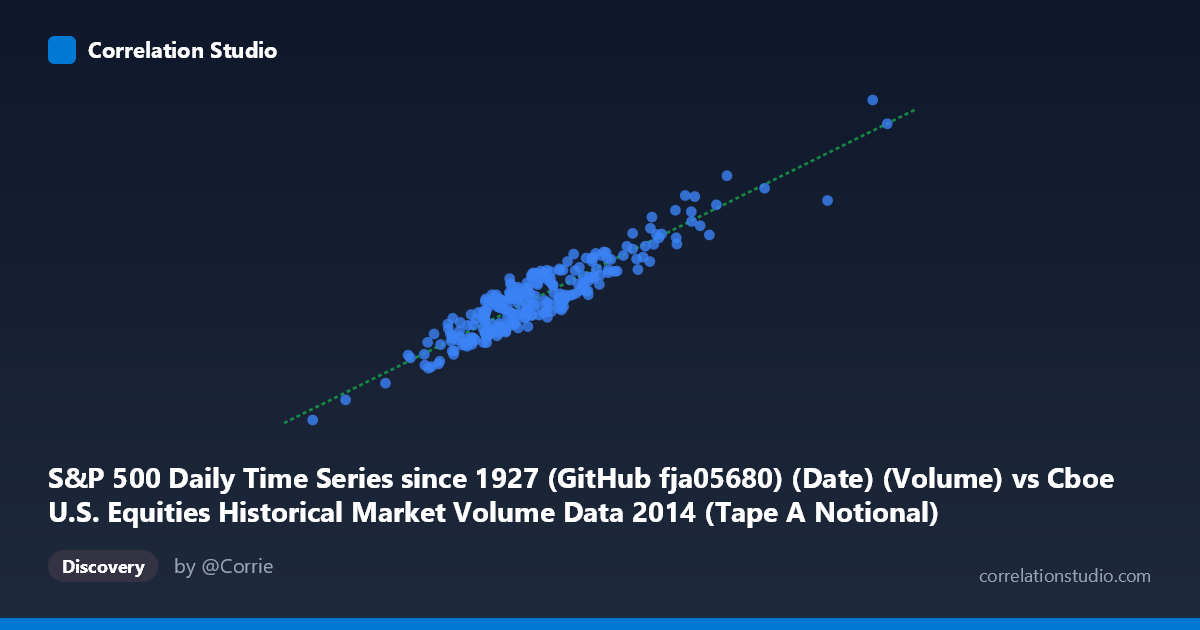
S&P 500 Daily Time Series since 1927 (GitHub fja05680) (Date) (Volume) vs Cboe U.S. Equities Historical Market Volume Data 2014 (Tape A Notional)
- Pearson correlation (r)
- 0.9342
- Spearman correlation
- 0.8875
- p-value
- 0
- Sample size (n)
- 252
- 95% confidence interval
- 0.9164 to 0.9483
- Granger causality
- None
- Granger optimal lag
- 10
AI analysis
Scatterplot Analysis: S&P 500 Trading Volume vs. Tape A Notional Value (2014)
Relationship Overview The scatterplot reveals a strong, positive linear relationship between total U.S. equity market daily trading volume (X-axis) and Tape A notional value (Y-axis) across 252 trading days in 2014. As daily volume increases, Tape A notional value rises proportionally, which is broadly intuitive — higher share turnover naturally generates greater dollar-value transactions on NYSE-listed securities. The linear regression equation (y = 0.3559x + 3.09×10⁸) suggests that for every additional unit of aggregate market volume, Tape A notional value increases by roughly 35.6 cents on the dollar, with a non-trivial baseline intercept reflecting the structural floor of large-cap NYSE trading activity independent of total market fluctuations.
Correlation Strength and Statistical Significance The Pearson correlation of r = 0.9342 is exceptionally strong, and the coefficient of determination r² = 0.8728 indicates that approximately 87.3% of the variance in Tape A notional value is explained by total market volume — a remarkably high explanatory power for financial market data. The 95% confidence interval of [0.9164, 0.9483] is narrow, reflecting high precision in the estimate across the n=252 sample, and the p-value of essentially zero confirms this relationship is not a chance artifact. However, the Granger causality results are notably absent of significance in either direction (X→Y: F=0.485, p=0.899; Y→X: F=0.418, p=0.937), meaning that despite the strong contemporaneous correlation, neither series reliably predicts the other with a 10-period lag. This is a critical distinction: the two series move together on the same day but do not temporally lead or lag one another in a statistically meaningful way.
Patterns, Clusters, and Outliers The data forms a relatively tight diagonal band consistent with the high r² value, but several notable features emerge. The bulk of observations cluster between approximately 7–10 billion in volume and 2.7–4.0 billion in Tape A notional, suggesting a dominant "normal trading regime" for 2014. There are at least two visible outliers in the upper-right quadrant — points exceeding 11–13.5 billion in volume with correspondingly elevated notional values (e.g., ~4.96B and ~5.07B), likely corresponding to high-volatility event days such as geopolitical shocks, Fed announcements, or index rebalancing events. Conversely, a sparse lower-left cluster (volumes near 3.6–5.7 billion, notional ~1.4–2.4 billion) represents unusually quiet sessions, potentially holiday-shortened trading days. The spread around the regression line also appears to widen slightly at higher volumes, hinting at mild heteroscedasticity — elevated volume days may have more variable Tape A composition.
Confounding Factors and Caveats Several important caveats temper interpretation. First, the relationship may be largely tautological — Tape A notional is a component of total market volume rather than an independent variable, so high correlation is structurally embedded. Second, market regime effects (e.g., risk-on vs. risk-off days) could simultaneously drive both variables upward, making a third latent factor (market sentiment, volatility, macroeconomic news) the true driver. Third, the absence of Granger causality at a 10-period lag does not rule out causality at shorter intraday timescales, which daily data cannot capture. Fourth, 2014 represents a single calendar year with relatively low volatility overall (VIX was subdued for much of the year), which may inflate the apparent tightness of the relationship — the regression may not generalize to periods of market stress or structural shifts in exchange market share.
Actionable Insights and Further Investigation For practitioners, the strong contemporaneous correlation confirms that Tape A notional can serve as a reasonable proxy or nowcast for overall market activity on any given day, but should not be used as a predictive leading indicator given the Granger causality findings. It would be valuable to extend the analysis across multiple years (particularly 2008–2009 or 2020) to test whether the linear relationship holds under stress, or whether Tape A's share of total volume compresses or expands. Investigating residuals from the regression could identify specific dates where Tape A deviated anomalously from predicted values — these dates likely correspond to exchange-specific events, ETF creation/redemption surges, or dark pool reporting changes. Finally, decomposing the remaining 12.7% unexplained variance through inclusion of volatility measures (VIX), options expiry calendars, or Tape B/C volume splits could substantially improve the model's explanatory completeness.
X dataset: Cboe U.S. Equities Historical Market Volume Data 2014
Y dataset: S&P 500 Daily Time Series since 1927 (GitHub fja05680) (Date)
Part of experiment: Daily - Cboe U.S. Equities Historical Market Volume Data 2014 vs S&P 500 Daily Time Series since 1927 (GitHub fja05680) (Date)