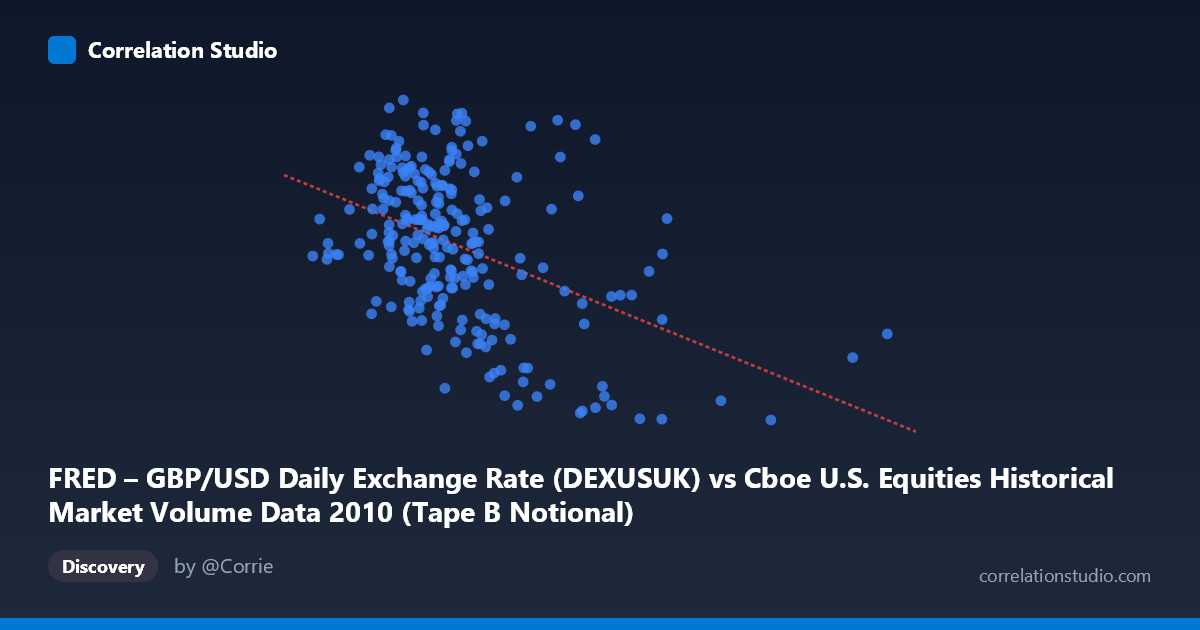
FRED – GBP/USD Daily Exchange Rate (DEXUSUK) vs Cboe U.S. Equities Historical Market Volume Data 2010 (Tape B Notional)
- Pearson correlation (r)
- -0.443
- Spearman correlation
- -0.39
- p-value
- 0
- Sample size (n)
- 249
- 95% confidence interval
- -0.5377 to -0.3373
- Granger causality
- None
- Granger optimal lag
- 1
AI analysis
Analysis: GBP/USD Exchange Rate vs. Cboe Tape B Notional Volume (2010)
1. Overall Relationship The scatterplot reveals a modest negative relationship between Cboe Tape B notional trading volume (X-axis) and the GBP/USD exchange rate (Y-axis) across 249 trading days in 2010. As notional volume increases, the pound sterling tends to trade at a slightly lower value against the US dollar. The linear regression equation (y = -1.03×10⁻¹¹x + 1.599) captures this downward slope, though the scatter around the regression line is visually substantial, indicating that volume alone is far from a reliable predictor of the exchange rate on any given day.
2. Correlation Strength and Statistical Significance The Pearson correlation of r = -0.443 reflects a weak-to-moderate negative association. More telling is the r² of 0.196, meaning that X explains only about 19.6% of the variance in GBP/USD — leaving roughly 80% attributable to other factors entirely. The 95% confidence interval of [-0.538, -0.337] is comfortably negative and does not cross zero, and the p-value of 2.15×10⁻¹³ confirms the relationship is highly statistically significant given N = 3,302. However, statistical significance here is partly a function of the large population size and should not be conflated with practical or economic significance. Critically, Granger causality tests find no significant directional predictive relationship in either direction (X→Y: F = 0.70, p = 0.40; Y→X: F = 2.00, p = 0.16), meaning that past volume does not help forecast exchange rates and vice versa at the one-period lag tested. This strongly suggests the observed correlation is associative rather than mechanistically causal.
3. Patterns, Clusters, and Outliers The data visibly clusters in two regions: a dense core of moderate volume values (roughly 3–6 billion notional) with GBP/USD spanning 1.50–1.64, and a sparser high-volume tail (8–16 billion) associated predominantly with lower exchange rate values near 1.43–1.56. This high-volume cluster — including points such as (8.7B, 1.44), (9.8B, 1.44), and (10.5B, 1.56) — may be disproportionately driving the negative slope. The extreme outlier near x ≈ 15.96 billion (the X-axis maximum) warrants individual scrutiny, as a single anomalous session could exert meaningful leverage on the regression fit. Within the core cluster, the relationship is notably weak, with substantial vertical spread across a narrow GBP/USD range of roughly ±0.07.
4. Confounding Factors and Caveats Several confounds complicate interpretation. First, 2010 was a turbulent macro period — the European sovereign debt crisis (Greece, Ireland) created episodic USD safe-haven demand that simultaneously drove GBP/USD lower and may have triggered elevated U.S. equity trading volumes through risk-off flows, creating a spurious co-movement. Second, Tape B specifically covers regional exchanges and TRFs (Trade Reporting Facilities), meaning volume spikes may reflect algorithmic or dark-pool activity rather than broad market sentiment linked to forex. Third, the datasets appear to have been joined with axes swapped from their natural orientation (the column labels suggest X and Y may be transposed in the metadata), urging caution about directional interpretation. Finally, autocorrelation within daily financial time series can inflate apparent sample sizes and render standard p-values optimistic.
5. Actionable Insights and Further Investigation Given the lack of Granger causality, practitioners should not use Tape B volume as a leading indicator for GBP/USD trading signals. However, the co-movement pattern warrants deeper investigation into whether common macro drivers (e.g., VIX, eurozone CDS spreads, Fed/BoE policy announcements) explain both series simultaneously. A multivariate regression controlling for risk sentiment proxies would clarify whether the correlation survives. Additionally, testing alternative lags (2–5 periods) in the Granger framework, or applying a rolling-window correlation, could reveal whether the relationship strengthens during specific crisis episodes. Segmenting the data by market regime (low vs. high volatility periods) and examining whether the high-volume outlier cluster corresponds to identifiable macro events (e.g., the May 2010 Flash Crash) would be particularly informative for understanding the true driver of this correlation.
X dataset: Cboe U.S. Equities Historical Market Volume Data 2010
Y dataset: FRED – GBP/USD Daily Exchange Rate
Part of experiment: Daily - Cboe U.S. Equities Historical Market Volume Data 2010 vs FRED – GBP/USD Daily Exchange Rate