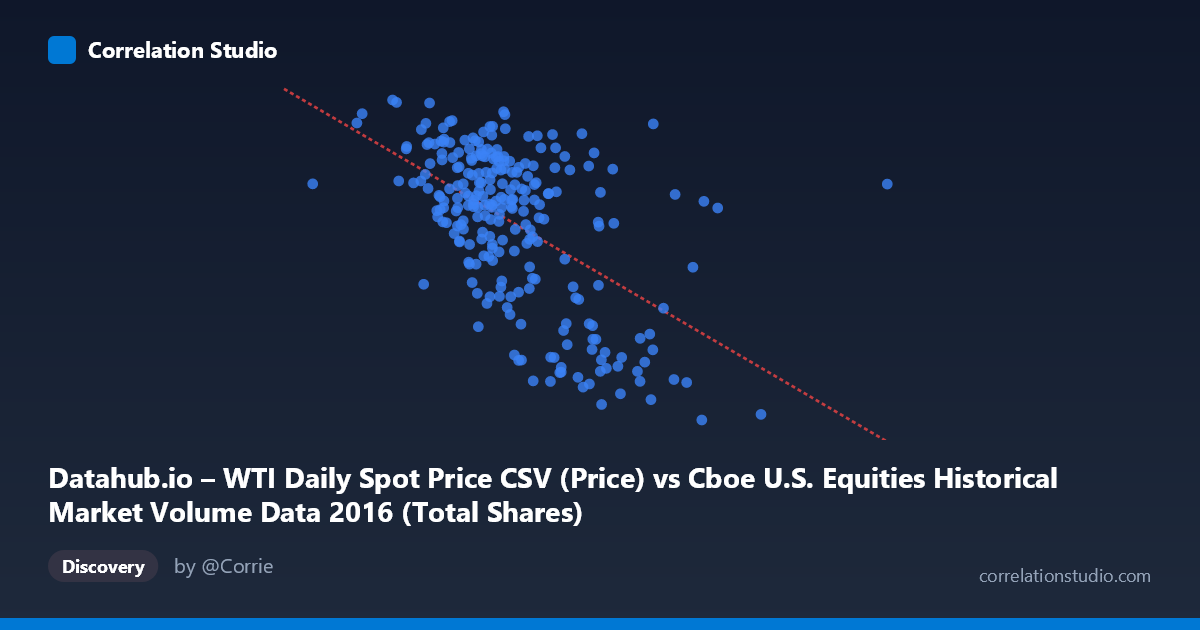
Datahub.io – WTI Daily Spot Price CSV (Price) vs Cboe U.S. Equities Historical Market Volume Data 2016 (Total Shares)
- Pearson correlation (r)
- -0.5422
- Spearman correlation
- -0.4964
- p-value
- 0
- Sample size (n)
- 252
- 95% confidence interval
- -0.624 to -0.4487
- Granger causality
- None
- Granger optimal lag
- 1
AI analysis
Scatterplot Analysis: WTI Oil Price vs. U.S. Equity Market Volume (2016)
Relationship Overview
The scatterplot reveals a negative relationship between WTI crude oil spot prices (X-axis) and total shares traded on U.S. equity exchanges (Y-axis) across 252 trading days in 2016. As oil prices rise, equity market volume tends to decline, and vice versa. The linear regression equation (y = -3.27×10⁻⁸x + 60.08) confirms this inverse trend, with higher oil price values associated with meaningfully lower share volume. This pattern is visually apparent in the data, where lower-price observations (clustered toward the left) tend to sit higher on the Y-axis, while higher-price observations drift downward — though with considerable scatter throughout.
Correlation Strength and Statistical Significance
The Pearson correlation of r = -0.54 indicates a moderate negative association. However, the coefficient of determination (r² = 0.294) tells a more sobering story: only ~29.4% of the variance in equity trading volume is explained by WTI oil prices, leaving roughly 70% attributable to other factors entirely. The 95% confidence interval of [-0.624, -0.449] is relatively tight and does not cross zero, and the p-value is effectively zero, confirming this is not a chance finding at the n = 252 sample level within a population of N = 3,622 observations. That said, the Granger causality tests are notably non-significant in both directions (X→Y: F = 0.70, p = 0.40; Y→X: F = 0.89, p = 0.35), meaning that neither variable reliably predicts the other temporally with a one-period lag. This is a critical caveat: the contemporaneous correlation is real and statistically robust, but there is no evidence of a predictive or directional causal mechanism operating day-to-day.
Notable Patterns, Clusters, and Outliers
Several features stand out in the sample points. There is a visible cluster of high-volume, moderate-to-low oil price observations (roughly X: 400M–500M range, Y: 44–51) that forms a dense core. A secondary pattern emerges at higher oil prices (600M–700M+) where volume drops sharply toward the 29–33 range — points like (708M, 29.55) and (635M, 33.21) are notable potential outliers pulling the regression slope downward. Conversely, some observations at lower oil prices still show relatively modest volume (e.g., 523M, 34.52), suggesting the relationship is far from deterministic. The spread around the regression line is substantial throughout, reinforcing the modest r² value and hinting at possible non-linear or threshold effects — volume may be more sensitive to oil prices above certain levels.
Confounding Factors and Interpretive Caveats
This correlation likely captures a shared response to broader macroeconomic conditions rather than a direct causal link. In early-to-mid 2016, oil prices were recovering from multi-year lows, a period also characterized by elevated market uncertainty and volatility-driven trading surges — which could simultaneously inflate volume and suppress oil prices. Volatility indices (VIX), Federal Reserve policy signals, and global risk sentiment are plausible confounders that drive both variables independently. Additionally, the axis labels appear to have a data-to-column assignment note worth flagging: the X-axis is labeled as WTI price sourced from the Cboe dataset column, and the Y-axis references total shares from the WTI dataset — this warrants verification that the merge and column mapping were applied correctly before drawing firm conclusions. The single-year window (2016) also limits generalizability.
Actionable Insights and Further Investigation
Despite the absence of Granger causality, the moderate contemporaneous correlation is worth exploring further. Analysts should consider: (1) extending the dataset beyond 2016 to test whether this relationship is structurally persistent or specific to the oil-price-recovery environment of that year; (2) introducing VIX or macro uncertainty indices as control variables to isolate whether oil price is independently associated with volume after accounting for volatility; (3) testing for non-linear specifications (e.g., piecewise regression or a polynomial fit) given the apparent clustering at extreme X values; and (4) examining sector-level equity volume (energy stocks specifically) rather than aggregate market volume, which may reveal a stronger and more mechanistically interpretable signal. The lack of Granger causality suggests that trading strategies based on oil prices as a leading indicator of volume would not be reliable.
X dataset: Cboe U.S. Equities Historical Market Volume Data 2016
Y dataset: Datahub.io – WTI Daily Spot Price CSV
Part of experiment: Daily - Cboe U.S. Equities Historical Market Volume Data 2016 vs Datahub.io – WTI Daily Spot Price CSV