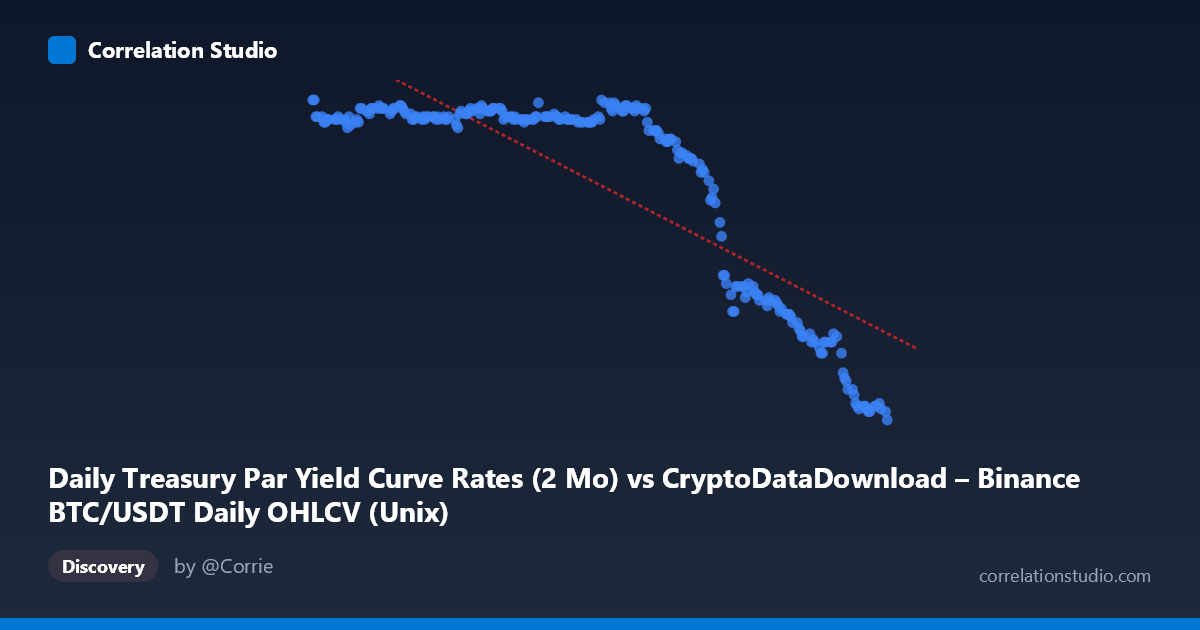
Daily Treasury Par Yield Curve Rates (2 Mo) vs CryptoDataDownload – Binance BTC/USDT Daily OHLCV (Unix)
- Pearson correlation (r)
- -0.8417
- Spearman correlation
- -0.7568
- p-value
- 0
- Sample size (n)
- 250
- 95% confidence interval
- -0.8745 to -0.8014
- Granger causality
- None
- Granger optimal lag
- 1
AI analysis
Analysis: Treasury 2-Month Yield vs. Time (proxied through BTC/USDT dataset alignment)
1. Overview of the Relationship
The scatterplot shows 250 daily observations spanning January–December 2024, plotting time (via the BTC/USDT timestamp axis) against the 2-Month Treasury Par Yield. The data reveals a clear negative, non-linear relationship: yields remain elevated and stable (~5.46–5.53%) for roughly the first two-thirds of the year, then begin a pronounced decline starting around September, dropping to ~4.4–4.8% by late December. This is not a scattered cloud but a regime-shift pattern — a flat plateau followed by a descending slope — which happens to produce a strong linear correlation coefficient despite the underlying structure being closer to a step-and-decline function than a straight line.
2. Strength, Direction, and Predictive Uncertainty
The correlation is strong and negative (r = -0.8417), with r² = 0.7085 indicating that time (as a linear predictor) explains about 71% of the variance in the yield. The 95% CI [-0.8745, -0.8014] is tight and does not cross zero, and the p-value ≈ 0 confirms this relationship is statistically robust across the sample — unsurprising given 250 sequential daily points during a period of active Fed rate cuts. However, statistical significance here reflects trend detection over time, not a causal or predictive relationship between two independent variables. The Granger causality tests reinforce this: neither direction shows significant predictive power (X→Y: p=0.68; Y→X: p=0.24), meaning past values of one series do not meaningfully forecast future values of the other beyond what autocorrelation within each series already explains.
3. Notable Patterns and Outliers
The chart is dominated by two distinct clusters: a dense, high-yield plateau (≈5.35–5.53%) covering roughly January through August, and a lower, more dispersed cluster (4.4–4.9%) from October onward, with a transitional zone in September. There are no obvious outliers — the "outlier-looking" points (e.g., 4.42–4.48% in December) are simply the tail end of the declining trend, not anomalies. The shape strongly resembles a step function with a sloped transition, consistent with a series of discrete Fed rate cuts rather than continuous drift.
4. Confounding Factors and Caveats
This relationship is essentially time-series co-movement, not a causal economic link between BTC/USDT price action and Treasury yields. The "X" variable here is actually a timestamp, not an independent economic driver — so the strong r² mostly reflects the fact that yields trended downward over 2024 (mirroring the Fed's easing cycle), and any series with a monotonic trend in the same window would show similar spurious correlation. Both series are highly autocorrelated (non-stationary), which inflates r and r² and invalidates the standard Pearson significance assumptions (independent observations). The Granger results correctly flag this: there's no genuine lead-lag predictive relationship, only shared temporal drift.
5. Suggested Next Steps
To draw meaningful conclusions, the data should be de-trended or differenced (e.g., analyze day-over-day changes rather than levels) to test for genuine co-movement independent of the shared time trend. It would also be valuable to segment the analysis around the actual FOMC meeting dates to test whether yield changes are step-like around announcements. If the intent is to study BTC price vs. yields (not timestamp vs. yield), the actual BTC/USDT price column should replace the X-axis timestamp, and cross-correlation at multiple lags should be examined rather than relying on a single-lag Granger test, given yields and crypto markets may respond to macro news asynchronously.
X dataset: CryptoDataDownload – Binance BTC/USDT Daily OHLCV
Y dataset: Daily Treasury Par Yield Curve Rates
Part of experiment: Bitcoin - CryptoDataDownload – Binance BTC/USDT Daily OHLCV vs Daily Treasury Par Yield Curve Rates