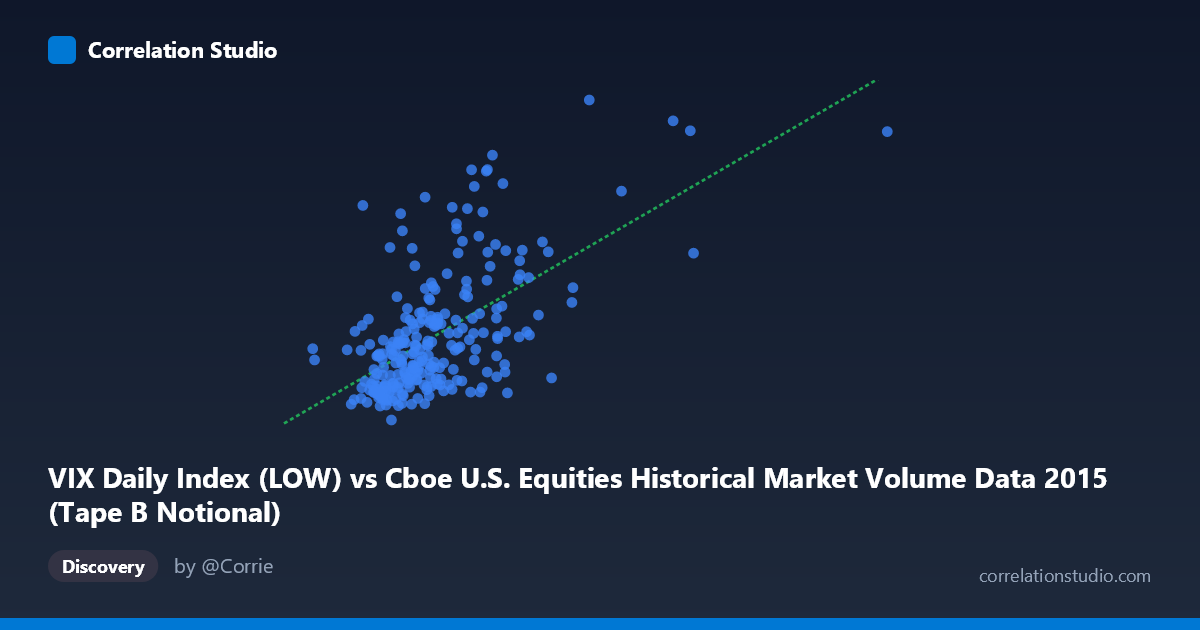
VIX Daily Index (LOW) vs Cboe U.S. Equities Historical Market Volume Data 2015 (Tape B Notional)
- Pearson correlation (r)
- 0.5994
- Spearman correlation
- 0.5414
- p-value
- 0
- Sample size (n)
- 252
- 95% confidence interval
- 0.5139 to 0.6731
- Granger causality
- None
- Granger optimal lag
- 1
AI analysis
Scatterplot Analysis: VIX Tape B Notional vs. VIX Daily Index (LOW)
Relationship Overview The scatterplot reveals a moderate positive relationship between the Cboe U.S. Equities Historical Market Volume (VIX Daily Index LOW) on the X-axis and the Tape B Notional value on the Y-axis. As market volume increases, VIX-related notional values tend to rise correspondingly, which is intuitively consistent with the well-established link between equity market activity and volatility. The linear regression equation (y = 1.257E-09x + 8.987) confirms this upward trend, though the scatter around the regression line is visibly substantial, indicating the relationship is real but far from deterministic.
Correlation Strength and Statistical Significance The Pearson correlation of r = 0.5994 indicates a moderate positive association, but the explanatory power is more sobering: r² = 0.3593 means only ~35.9% of the variance in Tape B Notional is explained by the VIX LOW volume metric, leaving roughly 64% attributable to other factors. The 95% confidence interval [0.5139, 0.6731] is meaningfully wide, suggesting some uncertainty in the precise strength of this relationship, though it firmly excludes zero. The p-value of effectively 0 (against N = 3,302) confirms the correlation is highly statistically significant and not a sampling artifact. However, statistical significance should not be conflated with practical or causal significance. Critically, Granger causality testing finds no significant directional predictive relationship in either direction — neither X→Y (F = 0.0225, p = 0.8809) nor Y→X (F = 0.3762, p = 0.5402) — meaning that knowing one variable's past values does not meaningfully improve short-term forecasts of the other at a one-period lag. The correlation is contemporaneous rather than temporally predictive.
Notable Patterns, Clusters, and Outliers Several structural features are visible in the data. The bulk of observations cluster in the lower-left region, roughly between X values of 3–6 billion and Y values of 11–20, suggesting that moderate-volume, moderate-volatility conditions dominated most of 2015 trading days. However, there are notable high-leverage outliers in the upper-right quadrant — points such as (12,491,974,395, 28.08) and (12,581,025,906, 20.80) represent days of exceptionally high market volume coinciding with elevated VIX readings. These likely correspond to the late-August 2015 market selloff, a period of acute volatility driven by China economic concerns. There is also visible heteroscedasticity: variance in Y expands as X increases, suggesting the relationship is not uniformly linear across the full range. This fan-shaped dispersion weakens the reliability of linear regression at higher volume levels.
Confounding Factors and Caveats Several important caveats apply. First, the axis labeling appears paradoxical — the X-axis is labeled "VIX Daily Index (LOW)" sourced from a market volume dataset, while the Y-axis is "Tape B Notional" sourced from the VIX dataset; this cross-sourcing warrants careful verification of variable assignments before drawing firm conclusions. Second, both variables are likely driven by common underlying market conditions (e.g., macro shocks, earnings seasons, geopolitical events) rather than one causing the other — consistent with the failed Granger causality tests. Third, the 2015 sample period is not representative of all market regimes, as it includes the August volatility spike, which may be disproportionately inflating the correlation. Fourth, Tape B Notional reflects NYSE American and regional exchange activity specifically, so it captures only a segment of broader market volume, potentially introducing selection bias.
Actionable Insights and Further Investigation Practitioners should not use VIX LOW volume as a predictive signal for Tape B Notional (or vice versa) given the absence of Granger causality — the relationship is contemporaneous and likely reflects shared response to market conditions rather than a lead-lag dynamic. To better understand the ~64% unexplained variance, analysts should investigate additional covariates such as VIX HIGH, S&P 500 intraday range, macroeconomic news release calendars, or sector-specific flow data. It would also be valuable to test for non-linear or regime-dependent relationships — a piecewise regression separating calm-market days from high-volatility days (e.g., VIX 20) may reveal structurally different dynamics. Finally, replicating this analysis across multiple years would help distinguish whether the moderate correlation observed in 2015 is stable or an artifact of that year's specific volatility episodes.
X dataset: Cboe U.S. Equities Historical Market Volume Data 2015
Y dataset: VIX Daily Index
Part of experiment: Daily - Cboe U.S. Equities Historical Market Volume Data 2015 vs VIX Daily Index