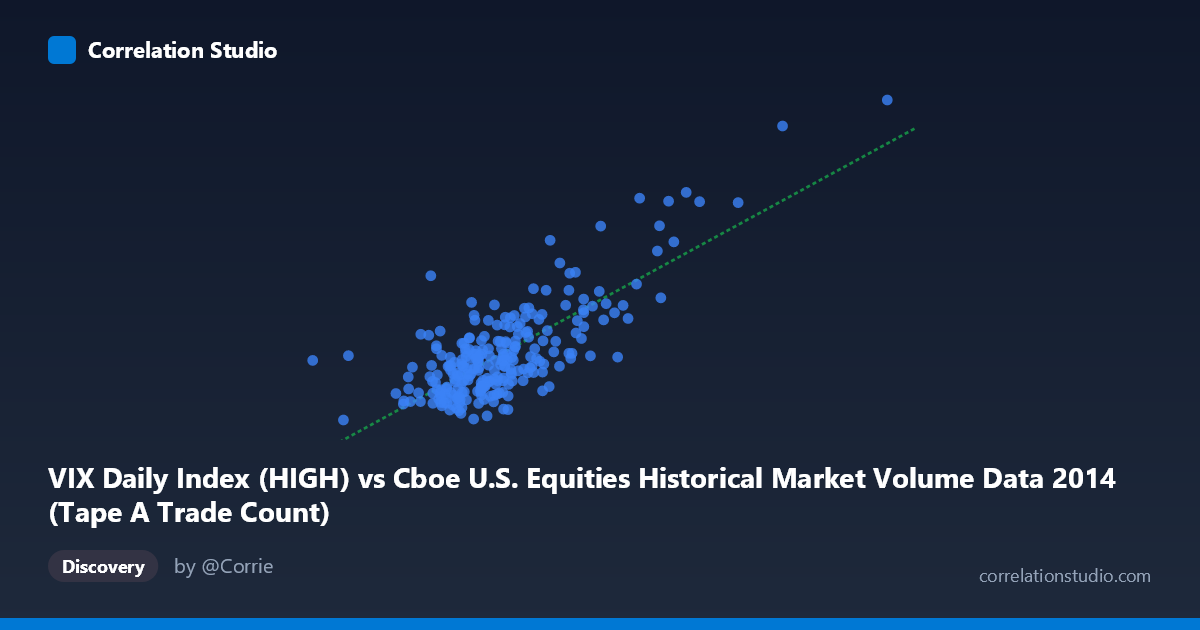
VIX Daily Index (HIGH) vs Cboe U.S. Equities Historical Market Volume Data 2014 (Tape A Trade Count)
- Pearson correlation (r)
- 0.7723
- Spearman correlation
- 0.6082
- p-value
- 0
- Sample size (n)
- 252
- 95% confidence interval
- 0.7172 to 0.8179
- Granger causality
- None
- Granger optimal lag
- 1
AI analysis
Scatterplot Analysis: VIX High vs. Tape A Trade Count (2014)
Relationship Overview
The scatterplot reveals a positive, moderately strong linear relationship between the CBOE VIX Daily High Index and Tape A Trade Count across U.S. equities exchanges throughout 2014. As the VIX High increases — reflecting greater implied volatility and market fear — trading activity (measured by Tape A trade counts) rises correspondingly. This is intuitive: elevated volatility environments drive higher transaction volumes as market participants react to uncertainty, rebalance portfolios, and execute hedging strategies. The fitted regression line (y = 9.88×10⁻⁶x + 3.23) confirms a positive slope, though the intercept and scale suggest meaningful baseline trading activity even during low-volatility periods.
Correlation Strength and Statistical Significance
The Pearson correlation of r = 0.7723 indicates a strong positive association, and critically, the r² of 0.5965 means that approximately 59.7% of the variance in Tape A Trade Count is explained by VIX High levels — a substantial but incomplete explanatory share, leaving ~40% attributable to other factors. The 95% confidence interval of [0.7172, 0.8179] is relatively tight, reflecting reliable estimation precision given the sample of n = 252 paired observations drawn from a population of N = 3,686. The p-value of effectively zero confirms this correlation is highly unlikely to be a chance artifact. However, the Granger causality results complicate the narrative: neither direction (X→Y: F = 2.71, p = 0.101; Y→X: F = 0.27, p = 0.602) reaches conventional significance thresholds at lag-1, meaning that past VIX High values do not significantly predict future trade counts, and vice versa. This suggests the relationship is largely contemporaneous — the two variables move together on the same day but neither reliably leads the other temporally.
Notable Patterns, Clusters, and Outliers
The data exhibits a clear primary cluster concentrated in the lower-left region, roughly where VIX High values fall between 900,000–1,400,000 and Trade Count ranges from approximately 10.5 to 17. This dense cluster represents the dominant low-to-moderate volatility regime that characterized most of 2014's relatively calm market environment. However, there is a visually distinct upper-right cluster — several data points with VIX High values exceeding 1,800,000 and trade counts reaching 25–31 — which likely corresponds to specific stress episodes in 2014, most notably the October 2014 volatility spike triggered by Ebola fears and global growth concerns, when the VIX briefly surged above 30. The point at approximately (2,171,498, 29.41) appears to be a notable outlier or extreme event observation. The gap between the main cluster and these high-value points hints at a potentially non-linear or regime-switching dynamic rather than a purely linear relationship across the full range.
Confounding Factors and Interpretive Caveats
Several important caveats apply. First, reverse causality cannot be dismissed on conceptual grounds even though Granger tests are inconclusive — high trading volume itself contributes to intraday volatility measures, creating a simultaneous feedback loop that cross-sectional correlation cannot disentangle. Second, calendar effects (month-end rebalancing, earnings seasons, options expiration dates) simultaneously elevate both VIX readings and trade counts, acting as a confounding driver. Third, the dataset axis labels appear inverted in the metadata — VIX data is listed under the market volume dataset and vice versa — warranting verification of which column truly corresponds to each axis before drawing firm conclusions. Fourth, 2014 was an unusual year with generally suppressed volatility punctuated by brief spikes, meaning this relationship may not generalize to periods of sustained elevated volatility (e.g., 2008, 2020). Finally, Tape A covers only NYSE-listed securities, so this trade count is a partial proxy for total market activity.
Actionable Insights and Further Investigation
Practitioners could explore using same-day VIX High as an input feature in intraday volume forecasting models, given the contemporaneous strength of this relationship, though the lack of Granger causality means lagged-VIX approaches alone will underperform. It would be valuable to test non-linear specifications (e.g., log-log or piecewise regression) to better accommodate the apparent regime separation between calm and stress periods. Extending the analysis across multiple calendar years would reveal whether the r = 0.77 relationship is stable or sensitive to prevailing volatility regimes. Additionally, decomposing trade count by trade size or participant type (retail vs. institutional) could clarify whether the VIX-volume relationship is driven primarily by institutional hedging flows or broader retail reactivity. Finally, incorporating additional volatility measures (realized volatility, VIX term structure slope) alongside macroeconomic controls would help isolate the independent contribution of implied volatility to trading activity.
X dataset: Cboe U.S. Equities Historical Market Volume Data 2014
Y dataset: VIX Daily Index
Part of experiment: Daily - Cboe U.S. Equities Historical Market Volume Data 2014 vs VIX Daily Index