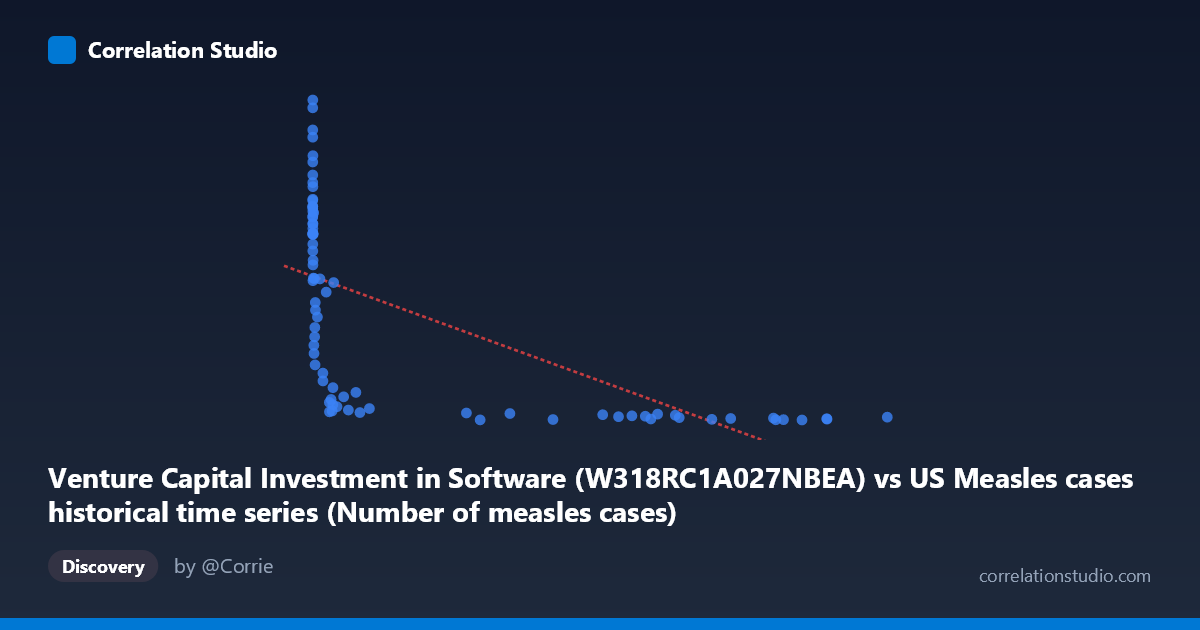
Venture Capital Investment in Software (W318RC1A027NBEA) vs US Measles cases historical time series (Number of measles cases)
- Pearson correlation (r)
- -0.6295
- Spearman correlation
- -0.9442
- p-value
- 0
- Sample size (n)
- 79
- 95% confidence interval
- -0.7467 to -0.4744
- Granger causality
- None
- Granger optimal lag
- 10
- Time coverage
- 1946-01-01 to 2024-01-01
- Recomputed on refreshed data
- 2026-10-18 (r was -0.6295)
AI analysis
Analysis: Venture Capital Investment in Software vs. US Measles Cases
1. What the Visualization Reveals
The scatterplot displays a striking inverse relationship between annual US Venture Capital investment in software and historical US measles case counts, spanning data from 1946 to 2024. The pattern is immediately recognizable: when X values (VC investment) are small — clustered near the left axis — Y values (measles cases) span a wide and elevated range (roughly 100–466 cases or units). As X increases dramatically into the hundreds of thousands, Y values collapse toward near-zero. This creates a characteristic hyperbolic or "hockey stick" shape that is highly suggestive of a non-linear relationship rather than a clean linear one. The bulk of data points cluster tightly at low X values with high Y variance, while the high-X points are sparse but consistently low on Y.
2. Correlation Strength, Direction, and Causality
The Pearson correlation of r = -0.6295 indicates a moderate-to-strong negative linear association, and the p-value of 5.15 × 10⁻¹⁰ confirms this is statistically significant well beyond conventional thresholds — the probability of observing this correlation by chance under the null hypothesis is vanishingly small. However, the R² of 0.396 is the more sobering figure: linear X explains only ~39.6% of the variance in Y, meaning roughly 60% of variation in measles cases is accounted for by factors entirely outside this model. The 95% confidence interval of [-0.747, -0.474] is reasonably tight and excludes zero convincingly, confirming the negative direction is reliable, though the width of the interval reflects meaningful uncertainty about the exact magnitude.
Critically, the Granger causality analysis finds no significant predictive direction in either direction (X→Y: F=1.85, p=0.078; Y→X: F=0.88, p=0.560). Neither variable temporally predicts the other at the optimal 10-period lag. This is a decisive finding: whatever correlation exists, it does not appear to reflect a predictive temporal mechanism in either direction. Furthermore, the note that Spearman ρ exceeds Pearson r strongly suggests the true underlying relationship is non-linear — a logarithmic or power-law fit would almost certainly explain substantially more variance than the reported 39.6%.
3. Notable Patterns, Clusters, and Outliers
Several features stand out in the data structure. First, there is a dense cluster of high-measles, low-investment observations (X < ~5,000; Y ranging 80–466) that likely corresponds to the pre-vaccine era (pre-1963) when measles was endemic and software investment was negligible. Second, the point (140, 466.42) appears to be a potential outlier at the extreme high end of Y, while (43, 455.02) and (72, 422.88) similarly sit at the upper Y boundary — these may represent epidemic years. Third, at very high X values ( 400,000), Y values are uniformly very low (1–10 range), consistent with near-elimination of measles in the modern era. The linear regression line (y = -0.000399x + 210) would dramatically misrepresent behavior at both extremes, reinforcing the non-linearity concern.
4. Confounding Factors and Interpretive Caveats
The most fundamental caveat here is the "third variable" problem — this correlation is almost certainly a shared time trend artifact. Both variables changed dramatically over the same historical period for entirely independent reasons: measles declined due to the introduction of the measles vaccine in 1963 and subsequent public health campaigns, while software VC investment grew due to the technology boom of the 1980s–2000s. These two phenomena share a common temporal driver (the passage of time and modernization) but have no plausible direct causal mechanism linking them. This is a textbook case of spurious correlation driven by coincident secular trends. Additional confounders include population growth, reporting methodology changes for both datasets, economic cycles, and the definitional scope of "VC investment." The dataset column labels also appear to be cross-labeled (X-axis described as measles from a VC dataset, and vice versa), which warrants careful verification of data provenance.
5. Actionable Insights and Further Investigation
Given the strong evidence of non-linearity, the immediate analytical priority should be fitting a logarithmic or power-law regression model (e.g., Y = a·ln(X) + b, or Y = a·X^b), which would almost certainly yield a substantially higher R² and a more honest representation of the data structure. To properly disentangle the time-trend confound, both series should be detrended or first-differenced before any correlation or Granger analysis is rerun — this would test whether changes in VC investment correlate with changes in measles incidence year-over-year, which is a far more meaningful question. Introducing year as a covariate in a multivariate model would help isolate any residual relationship after controlling for the shared time trend. Finally, if the research goal involves measles specifically, the analysis would benefit from incorporating vaccination coverage rates, CDC outbreak data, and international travel metrics as far more mechanistically relevant predictors.
X dataset: US Measles cases historical time series
Y dataset: Venture Capital Investment in Software
Part of experiment: Yearly - US Measles cases historical time series vs Venture Capital Investment in Software