Cboe U.S. Equities Historical Market Volume Data 2022 (Tape C Trade Count) vs CryptoDataDownload – Binance BTC/USDT Daily OHLCV (Open)
- Pearson correlation (r)
- 0.4284
- Spearman correlation
- 0.4669
- p-value
- 0
- Sample size (n)
- 251
- 95% confidence interval
- 0.3217 to 0.5244
- Granger causality
- None
- Granger optimal lag
- 10
- Time coverage
- 2022-01-03 to 2022-12-30
AI analysis
Analysis: Cboe Trade Count vs. BTC/USDT Opening Price (2022)
1. Relationship Overview
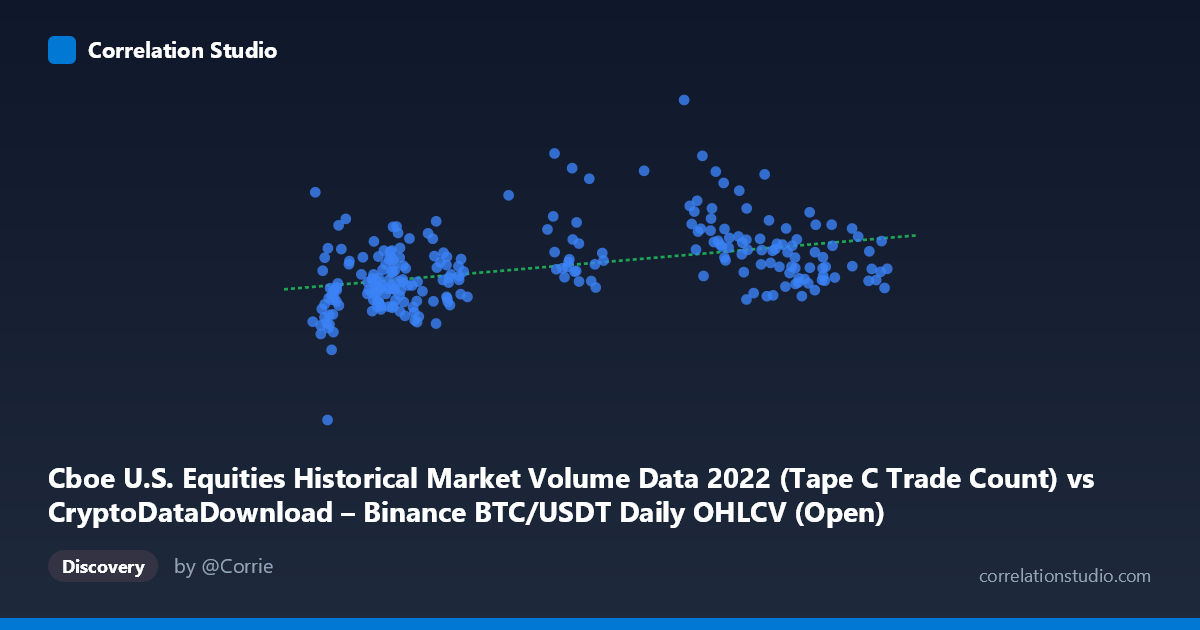
The scatterplot depicts a modest positive association between Cboe U.S. equities trade count (X) and Binance BTC/USDT opening price (Y) across 251 paired daily observations in 2022. The linear fit (y = 10.93x + 1,424,350) shows Y increasing gently as X rises, but the cloud of points is diffuse rather than tightly banded around the regression line, signaling considerable unexplained variability. This is a cross-domain pairing — equity market trade activity against a cryptocurrency price level — so any statistical relationship is more likely to stem from shared macro conditions than direct mechanical linkage.
2. Strength, Direction, and Statistical Confidence
The correlation coefficient (r = 0.428) indicates a weak-to-moderate positive linear relationship. Critically, r² = 0.1835 means only about 18% of the variance in BTC opening price is statistically associated with variance in Cboe trade counts — the remaining ~82% is driven by other factors entirely. The 95% CI [0.322, 0.524] is reasonably tight and excludes zero, and the p-value (1.26E-12) confirms this correlation is highly unlikely to be due to chance given the sample. However, statistical significance here reflects precision of estimation, not practical strength — a weak relationship, even if well-estimated, has limited predictive utility. The Granger causality tests reinforce this: neither direction (X→Y: p=0.667; Y→X: p=0.118) reaches significance, meaning trade counts do not meaningfully help forecast future BTC prices, nor vice versa. This is an important caveat — the contemporaneous correlation does not imply temporal lead-lag predictability.
3. Patterns, Clusters, and Outliers
The data shows loose clustering rather than a clean linear trend. A subgroup of points with X in the 29,000–41,000 range shows notably elevated Y values (e.g., 2.4M–2.5M), including (37988, 2411035), (40680.9, 2391499), and (29103.9, 2539165) — these appear to sit above the general trend line, suggesting possible short-lived BTC price spikes (consistent with early-2022 volatility before the mid-year crypto downturn) that aren't matched by proportionally higher equity trade counts. Meanwhile, many low-X points (15,000–20,000) cluster with Y values in the 1.35M–1.7M band, forming a denser lower-left mass. This heteroscedastic spread — wider variance in Y at mid-range X — suggests the relationship is not uniformly linear and may be better characterized by regime-dependent behavior (e.g., different market phases in 2022) rather than a single functional form.
4. Confounding Factors and Caveats
Both series are daily time series in 2022, a year marked by macro-driven volatility (Fed rate hikes, equity bear market, crypto contagion events like Terra/Luna and FTX). Any correlation is highly susceptible to confounding by common macro drivers — risk sentiment, interest rate expectations, and liquidity conditions likely moved both equity trading activity and BTC prices simultaneously without one causing the other. Additionally, both series may exhibit autocorrelation and trending (non-stationarity) typical of daily financial data, which can artificially inflate correlation estimates in linear/Pearson frameworks. The lack of Granger causality further supports that this is a spurious or indirectly-mediated association rather than a structural, exploitable relationship. Sample period is limited to one calendar year, so results may not generalize to other regimes.
5. Suggestions for Further Investigation
Given the weak explanatory power and absent causality, this pairing is not suitable as a standalone predictive signal. Recommended next steps: (1) test for stationarity (ADF test) and consider differencing or returns-based transformations rather than levels, which often reveals whether the raw-level correlation is spurious; (2) introduce control variables — e.g., VIX, DXY, or Fed policy indicators — to check if the X-Y relationship persists after controlling for shared macro drivers; (3) segment the year into volatility regimes (pre/post major crypto shocks) to test for regime-dependent correlation shifts; (4) explore lagged cross-correlation at finer granularity (1–5 day lags) since the Granger test used a 10-period lag, which might not capture faster interactions. Overall, treat this correlation as a statistically real but practically weak and non-causal association, best explained by shared exposure to broader financial market conditions rather than a direct functional link between equities trading activity and BTC pricing.
X dataset: CryptoDataDownload – Binance BTC/USDT Daily OHLCV
Y dataset: Cboe U.S. Equities Historical Market Volume Data 2022
Part of experiment: Bitcoin - CryptoDataDownload – Binance BTC/USDT Daily OHLCV vs Cboe U.S. Equities Historical Market Volume Data 2022