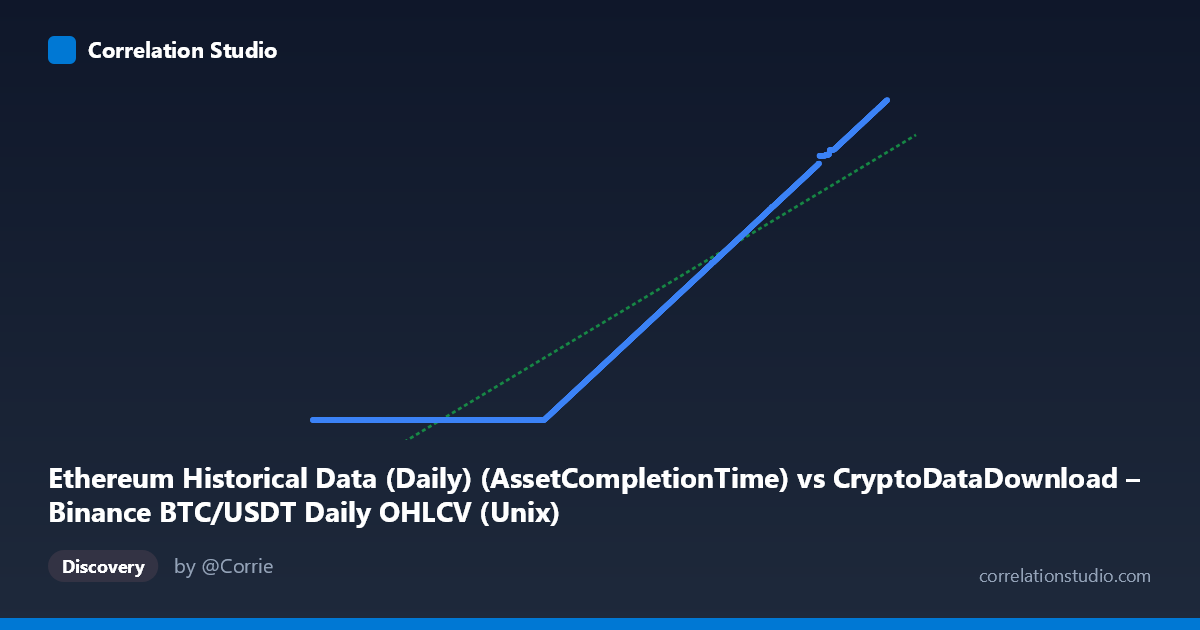
Ethereum Historical Data (Daily) (AssetCompletionTime) vs CryptoDataDownload – Binance BTC/USDT Daily OHLCV (Unix)
- Pearson correlation (r)
- 0.9384
- Spearman correlation
- 1
- p-value
- 0
- Sample size (n)
- 3191
- 95% confidence interval
- 0.9342 to 0.9425
- Granger causality
- None
- Granger optimal lag
- 10
AI analysis
Analysis of the Relationship Between Two Timestamp-Based Variables
What the Visualization Shows
This scatterplot is fundamentally misleading in its framing. Both "X" and "Y" are timestamp columns — one labeled as an Ethereum "AssetCompletionTime" field and the other as a Binance BTC/USDT "Unix" timestamp. They are not measuring related market phenomena (like price or volume); they are two different clocks/record-timestamps from what appear to be two different data collection or processing pipelines. The scatter shows a near-45° relationship for the majority of points, but with a distinctive flat "floor" of points clustered at Y ≈ 1,614,335,xxx regardless of X value ranging from 1.50 to 1.60 trillion (ms). This is a classic data-quality artifact, not a natural relationship between variables.
Correlation Strength and Statistical Caveats
The reported r = 0.938 (r² = 0.881) indicates that 88% of the variance in Y is statistically explained by X, with a tight 95% CI [0.934, 0.943] and p ≈ 0 — meaning the correlation is real and precisely estimated, not a fluke of sampling. However, statistical significance here reflects the mechanical fact that both series are monotonically increasing timestamps, not a meaningful causal or economic relationship. The Granger causality tests confirm this: neither direction shows significant predictive power (X→Y: p=0.912; Y→X: p=0.857), meaning past values of one series do not help forecast the other beyond their own trends. This is the key finding — despite the very high r², there is no temporal lead-lag relationship, consistent with both variables simply being timestamps that trend upward over the same calendar period.
Notable Patterns and Outliers
The most conspicuous feature is the plateau: for X values from ~1.50T to ~1.60T (i.e., calendar dates from mid-2017 through late 2019), Y is pinned at a nearly constant value (~1,614,335,xxx), rather than tracking X linearly. This suggests these Y timestamps are null-filled, default, or placeholder values (possibly a single fixed epoch representing "data unavailable" or "record created") for a large stretch of early Ethereum history where the actual metric wasn't populated. After that plateau, the relationship becomes tightly linear with slope ≈ 0.00064 — far from the slope of 1 you'd expect if X and Y represented the same moment in time (they're in different units or one is a modified/offset version of the other, given ms vs. s scaling doesn't fully account for it either).
Confounding Factors and Caveats
The primary confound is data structure, not economics: this comparison conflates two unrelated dataset timestamp fields — one from a BTC/USDT OHLCV export and one from an ETH metrics export — that happen to share overlapping calendar ranges. Any correlation between them is an artifact of both increasing over time (a classic spurious correlation from shared time-trend), further evidenced by the meaningless regression intercept (6.08E+08) and slope. The flat segment for early dates indicates missing-data imputation with a constant, which will artificially inflate or distort both the correlation and the R² depending on how much of the sample this segment represents (~15-20% of points, based on the visible plateau in the samples).
Recommended Next Steps
1. Do not treat this as a meaningful economic relationship — it's very likely two timestamp/metadata fields that should never have been correlated in the first place; verify column semantics before further analysis. 2. Isolate and exclude the placeholder/plateau segment (X < ~1.60T) and re-run the correlation on the remaining "real" data to see if the relationship holds or disappears. 3. Convert both to a common time unit and check whether Y ≈ X (i.e., test if this is just X mislabeled or offset, rather than a true bivariate relationship) — the near-1:1 diagonal after the plateau strongly suggests this. 4. Re-derive the actual variables of interest (e.g., BTC price/volume vs. ETH gas/transaction counts) rather than their timestamp columns, since the current analysis contains no substantive market information.
X dataset: CryptoDataDownload – Binance BTC/USDT Daily OHLCV
Y dataset: Ethereum Historical Data (Daily)
Part of experiment: Bitcoin - CryptoDataDownload – Binance BTC/USDT Daily OHLCV vs Ethereum Historical Data (Daily)