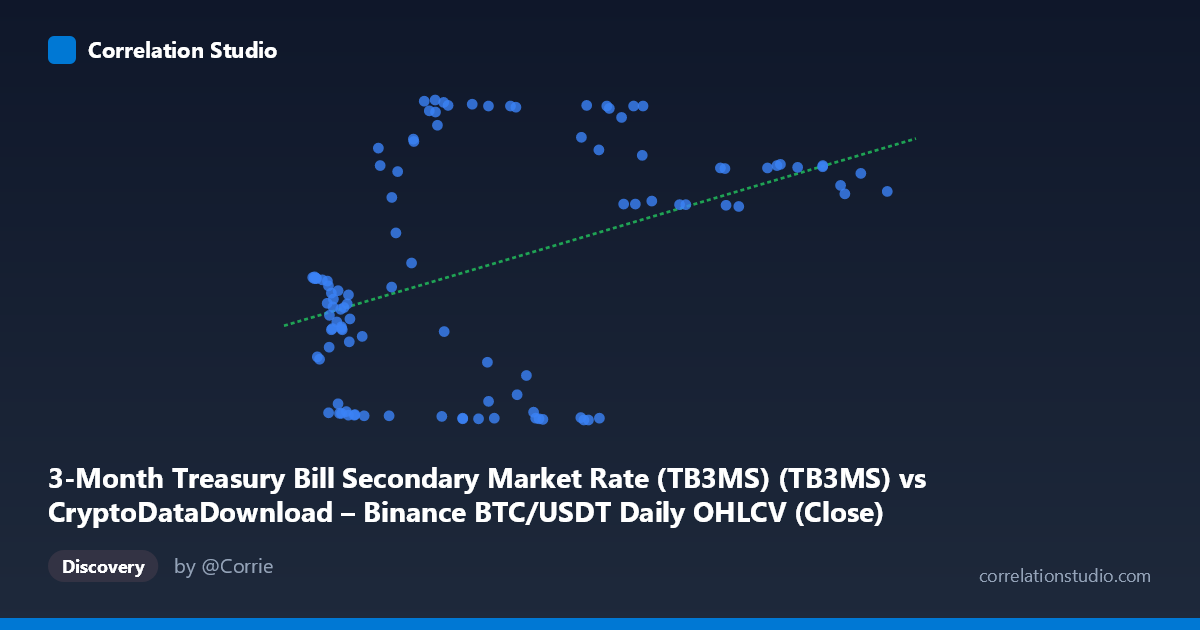
3-Month Treasury Bill Secondary Market Rate (TB3MS) (TB3MS) vs CryptoDataDownload – Binance BTC/USDT Daily OHLCV (Close)
- Pearson correlation (r)
- 0.4238
- Spearman correlation
- 0.3279
- p-value
- 0.000006
- Sample size (n)
- 106
- 95% confidence interval
- 0.2535 to 0.5686
- Granger causality
- Y → X
- Granger optimal lag
- 1
AI analysis
Analysis of BTC/USDT Price vs. 3-Month Treasury Bill Rate
1. What the Visualization Reveals
The scatterplot displays a modest positive association between the 3-Month Treasury Bill rate (X) and BTC/USDT closing price (Y). Rather than a clean linear trend, the data shows a distinctive bimodal or threshold-like pattern: at lower X-values (roughly below 15,000), Y-values cluster tightly near zero (0.02–0.16), while at higher X-values, Y-values scatter broadly between 1.0 and 5.3. This suggests the relationship may be driven more by a regime shift or step-function behavior than by continuous linear covariation.
2. Strength, Direction, and Statistical Confidence
The correlation coefficient (r = 0.42) indicates a moderate positive relationship, with r² = 0.177 meaning only 17.7% of the variance in Y is explained by X — the remaining 82% is attributable to other factors or noise. The 95% CI [0.249, 0.567] is reasonably tight and excludes zero, and the p-value (7.8×10⁻⁶) confirms this correlation is statistically significant and unlikely due to chance. However, statistical significance here reflects a real but weak-to-moderate linear association, not a strong predictive relationship. Critically, the Granger causality tests show no significant causal direction: X→Y is clearly non-significant (p=0.55), and Y→X is only marginally suggestive (p=0.07) but doesn't meet conventional significance thresholds. This means neither variable reliably predicts future movements in the other — the correlation may reflect a shared underlying driver rather than a causal mechanism.
3. Notable Patterns and Outliers
The most striking feature is the cluster of near-zero Y-values (0.03–0.16) occurring across a wide range of X-values (6,600–49,600), including several points where X is quite high (e.g., X=48,810, Y=0.04). This suggests these observations may correspond to a distinct market regime — potentially the near-zero interest rate environment of 2020–2021, when Bitcoin prices varied enormously independent of near-zero T-bill rates. The scatter tightens into a more linear-looking positive trend only in the higher X range (60,000), where Y values cluster between 3.5 and 5.3. This heterogeneity strongly suggests the overall correlation is disproportionately influenced by a small number of temporal clusters rather than a consistent relationship.
4. Confounding Factors and Caveats
Given the time span (2017–2026), macroeconomic regime changes are a major confound: the Fed's near-zero rate policy (2020–2021) coincided with a massive BTC bull run, while the 2022–2023 rate hikes coincided with both crypto crashes and recoveries — meaning time itself, not a genuine economic mechanism, may be driving the apparent correlation. Additionally, comparing a monthly macro indicator (TB3MS) to daily crypto closes introduces temporal misalignment, and 105 sampled points from 1,109 total observations may not proportionally represent all market regimes. Bitcoin's extreme volatility and multiple bull/bear cycles are unlikely to be well-captured by a simple linear model with T-bill rates, which change slowly and in discrete steps.
5. Suggestions for Further Investigation
Given the low r², non-significant Granger causality, and visible regime clustering, this correlation should not be used for predictive or trading purposes as-is. Further work should include: (a) segmenting data by known macro regimes (e.g., pre/post-2020 rate cuts) to test whether the relationship is an artifact of a specific period; (b) introducing lagged or differenced variables to test for delayed effects beyond the single-lag Granger test; (c) controlling for other confounds like inflation, equity market performance, or crypto-specific events (halving cycles, regulatory news); and (d) exploring nonlinear or regime-switching models (e.g., threshold regression) given the visual evidence of a step-like pattern rather than continuous covariation.
X dataset: CryptoDataDownload – Binance BTC/USDT Daily OHLCV
Y dataset: 3-Month Treasury Bill Secondary Market Rate (TB3MS)
Part of experiment: Bitcoin - CryptoDataDownload – Binance BTC/USDT Daily OHLCV vs 3-Month Treasury Bill Secondary Market Rate (TB3MS)