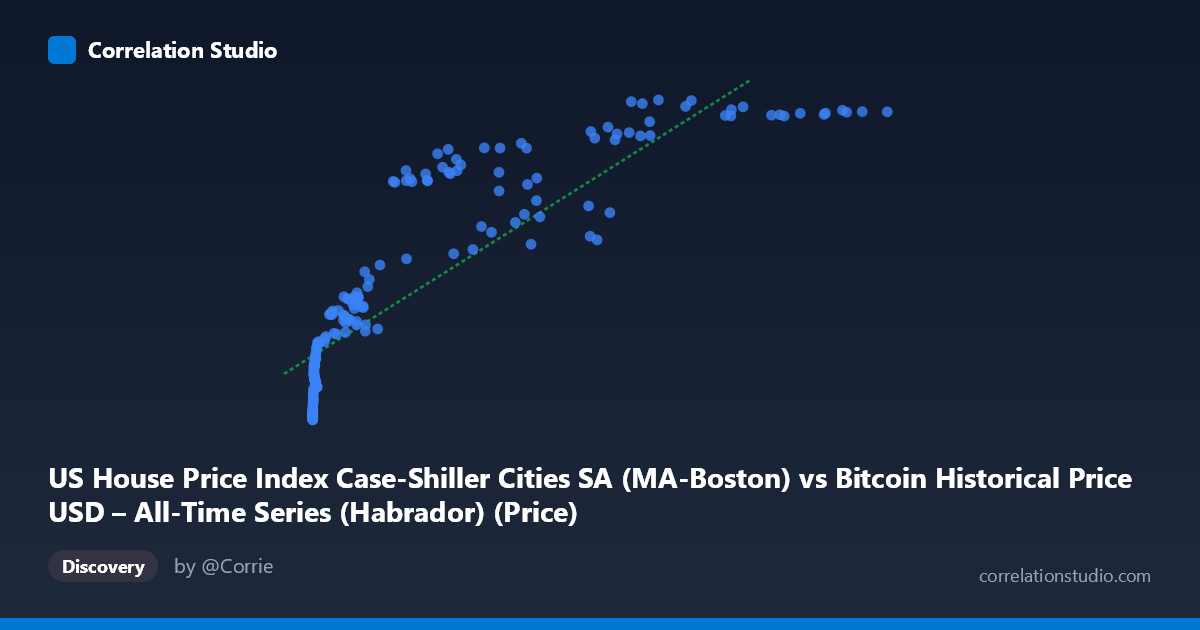
US House Price Index Case-Shiller Cities SA (MA-Boston) vs Bitcoin Historical Price USD – All-Time Series (Habrador) (Price)
- Pearson correlation (r)
- 0.8644
- Spearman correlation
- 0.9702
- p-value
- 0
- Sample size (n)
- 187
- 95% confidence interval
- 0.823 to 0.8967
- Granger causality
- None
- Granger optimal lag
- 9
AI analysis
Analysis: Bitcoin Price vs. US House Price Index (Boston, Case-Shiller)
1. What the Visualization Reveals
The scatterplot shows a strong positive association between Bitcoin's historical USD price and the Boston Case-Shiller Home Price Index over the 2010–2026 period. However, the relationship is clearly non-linear: at low Bitcoin prices (under ~$1,000), the Boston index clusters tightly in the 150–200 range, while as Bitcoin climbs into the tens of thousands, the index rises more gradually and begins to plateau near 340–350. This produces a classic logarithmic or saturating curve shape rather than a straight line — consistent with the note that Spearman's rank correlation exceeds Pearson's r.
2. Strength, Direction, and Uncertainty
The Pearson correlation (r = 0.864, R² = 0.747) indicates that a linear model explains roughly 75% of the variance in the housing index based on Bitcoin price, which is a substantial fit. The 95% confidence interval [0.823, 0.897] is fairly narrow, and the p-value is effectively zero, meaning this correlation is highly unlikely to be due to sampling noise given the data. However, correlation strength should not be conflated with causal or predictive power. The Granger causality tests are critical here: neither direction (Bitcoin→Housing or Housing→Bitcoin) shows statistical significance (p = 0.696 and p = 0.774, respectively) even at an optimal lag of 9 periods. This strongly suggests that the two series are not temporally predictive of one another — the correlation likely reflects a shared underlying trend (e.g., both rising over calendar time) rather than one variable driving the other.
3. Notable Patterns and Outliers
The data shows dense clustering at very low Bitcoin prices (sub-$100, sometimes fractions of a cent) paired with housing index values in the 148–165 range — this reflects Bitcoin's early years (2010–2013) when its price was negligible. As Bitcoin price increases past $10,000–$100,000, points spread more and the housing index compresses into a narrower high band (300–350), creating a "fan-in" or saturation pattern at the upper end. This ceiling effect in Y (housing index) as X grows large is the primary driver of the non-linearity — a log-transform of X would likely straighten the relationship substantially and improve fit.
4. Confounding Factors and Caveats
The most important caveat is that both series are monotonically increasing time series covering roughly the same 15+ year window. Any two variables that trend upward over time (Bitcoin price, home prices, stock indices, M2 money supply, etc.) will show spurious correlation without any causal link. The Granger non-causality result reinforces this: there's no evidence Bitcoin price movements predict housing index changes or vice versa at a monthly/periodic granularity. Likely confounders include macroeconomic conditions (interest rates, inflation, Fed policy, general asset-price appreciation), calendar-time trend, and the fact that both markets have experienced broad multi-year bull runs somewhat independently.
5. Actionable Insights
- Detrend before concluding causality: Since both series trend upward over time, analysts should difference the data (e.g., month-over-month % change) or regress out a time trend, then re-test correlation and Granger causality on the residuals/returns to see if a genuine relationship survives. - Try a log-log or log-linear model: Given the saturating shape and Spearman Pearson, transforming Bitcoin price to log scale is likely to yield a better-fitting, more interpretable model. - Treat this as a spurious/co-trending relationship for practical purposes (e.g., portfolio diversification, hedging) rather than a tradable predictive signal — the Granger results indicate Bitcoin price is not a useful leading indicator for Boston home prices, or vice versa, in this dataset. - Investigate common macro drivers directly (e.g., real interest rates, USD index, monetary supply) rather than treating one asset as a proxy for the other.
X dataset: Bitcoin Historical Price USD – All-Time Series (Habrador)
Y dataset: US House Price Index Case-Shiller Cities SA
Part of experiment: Bitcoin - Bitcoin Historical Price USD – All-Time Series (Habrador) vs US House Price Index Case-Shiller Cities SA