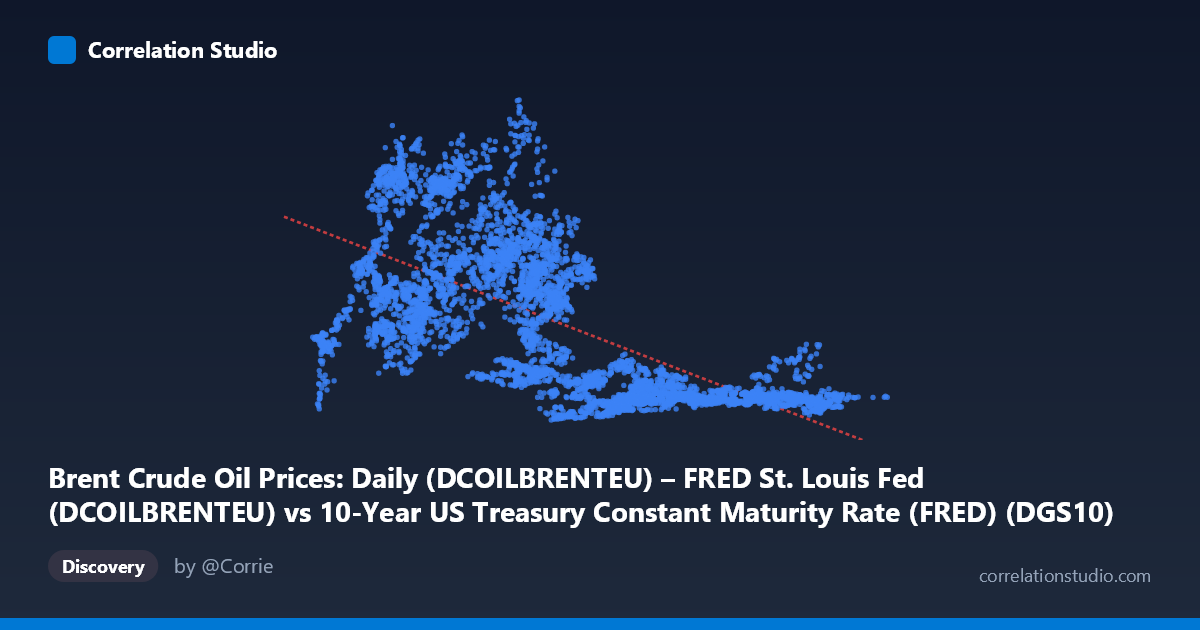
Brent Crude Oil Prices: Daily (DCOILBRENTEU) – FRED St. Louis Fed (DCOILBRENTEU) vs 10-Year US Treasury Constant Maturity Rate (FRED) (DGS10)
- Pearson correlation (r)
- -0.657
- Spearman correlation
- -0.709
- p-value
- 0
- Sample size (n)
- 9642
- 95% confidence interval
- -0.6682 to -0.6455
- Granger causality
- None
- Granger optimal lag
- 1
AI analysis
Brent Crude Oil Prices vs. 10-Year US Treasury Yield: Correlation Analysis
Relationship Overview
The scatterplot reveals a negative, moderately strong relationship between the 10-year US Treasury constant maturity rate (x-axis) and Brent crude oil prices (y-axis), spanning nearly four decades of daily data (1987–2026). The linear regression equation y = -9.68x + 95.13 indicates that for every one percentage point increase in the 10-year Treasury yield, Brent crude prices are associated with a decline of approximately $9.68 per barrel. Visually, the data cloud slopes clearly downward from left to right, but with considerable scatter around the regression line, suggesting the relationship is real but far from deterministic. Notably, higher Treasury yields cluster around lower oil prices, while the lowest yield readings (concentrated near 1–3%) correspond to a wide and volatile range of crude prices.
Correlation Strength and Statistical Significance
The Pearson correlation of r = -0.657 reflects a moderate-to-strong negative linear association. However, the coefficient of determination r² = 0.432 is the more practically informative statistic: it tells us that Treasury yield levels explain only 43.2% of the variance in Brent crude prices, leaving 56.8% unexplained by this relationship alone. The 95% confidence interval of [-0.668, -0.646] is notably narrow given the large paired sample (n = 9,642), and the p-value of effectively zero confirms the correlation is overwhelmingly unlikely to be a statistical artifact. That said, statistical significance with large N does not imply economic magnitude or causal relevance. Critically, the Granger causality tests fail in both directions — neither X→Y (F = 0.516, p = 0.473) nor Y→X (F = 1.340, p = 0.247) achieves significance at lag 1 — meaning that past values of Treasury yields do not meaningfully predict future oil prices, and vice versa. This absence of temporal predictive power is a significant caveat: the correlation may reflect shared macroeconomic drivers rather than any direct causal pathway between the two series.
Notable Patterns, Clusters, and Outliers
Several structural features stand out in the data. There is a dense central cluster around yields of 4–7% with oil prices broadly ranging from $15 to $40 per barrel, consistent with the pre-2000s era when yields were higher and the oil market was less globalized. A second, more diffuse cluster appears at very low yields (1–3%), corresponding to the post-2008 and COVID-era low-rate environment, where oil prices exhibit extreme variability — ranging from under $20 to nearly $144 per barrel. This bifurcation hints at a non-linear or regime-dependent relationship. Multiple outliers are visible at the upper-left of the chart (high oil prices, low yields), likely representing the 2008 oil price spike and the post-COVID commodity surge. The sample points confirm this: observations like (1.96, 119.30), (1.61, 110.06), and (1.31, 71.02) are striking examples of extremely high oil prices at near-zero yields, which disproportionately influence the regression slope.
Confounding Factors and Interpretive Caveats
This correlation almost certainly reflects shared sensitivity to common macroeconomic regimes rather than a direct mechanism between Treasury yields and crude prices. Both variables are strongly influenced by the business cycle: recessions tend to drive yields down (via Fed easing) while also often suppressing oil demand, yet the post-2008 period decoupled this pattern as quantitative easing compressed yields artificially while oil prices surged with emerging market demand. Inflation is a particularly important confounder — rising inflation tends to push both commodity prices higher and yields upward, yet structural disinflationary periods (2010s) kept yields low while oil was also moderate. Dollar strength, OPEC supply decisions, geopolitical shocks (Gulf Wars, Russia-Ukraine), and global demand shifts all independently move oil prices in ways that have no systematic relationship to US rate policy. The very long time horizon (1987–2026) also means the data spans multiple distinct economic regimes, making a single linear model a potentially misleading summary across structurally different eras.
Actionable Insights and Further Investigation
Given the moderate explanatory power and absent Granger causality, practitioners should resist using Treasury yields alone as a predictive signal for oil prices in any operational model. A more productive research direction would involve regime-segmented analysis — fitting separate models for distinct monetary policy eras (e.g., pre-2008, zero-lower-bound period, post-2022 rate hike cycle) to test whether the correlation is stable or artifact of pooling structurally different periods. Multiple regression incorporating the USD index, global PMI, and OPEC spare capacity would likely substantially improve explanatory power beyond the 43.2% achieved here. It would also be valuable to test longer Granger causality lags (beyond 1 period) and to apply cointegration testing (Engle-Granger or Johansen) to determine whether these series share a long-run equilibrium relationship rather than just a contemporaneous correlation. Finally, a rolling correlation analysis over 3–5 year windows would reveal whether the negative relationship has been consistent over time or has broken down in specific periods — essential context for any macro trading or policy application.
X dataset: 10-Year US Treasury Constant Maturity Rate (FRED)
Y dataset: Brent Crude Oil Prices: Daily (DCOILBRENTEU) – FRED St. Louis Fed
Part of experiment: Daily - 10-Year US Treasury Constant Maturity Rate (FRED) vs Brent Crude Oil Prices: Daily (DCOILBRENTEU) – FRED St. Louis Fed