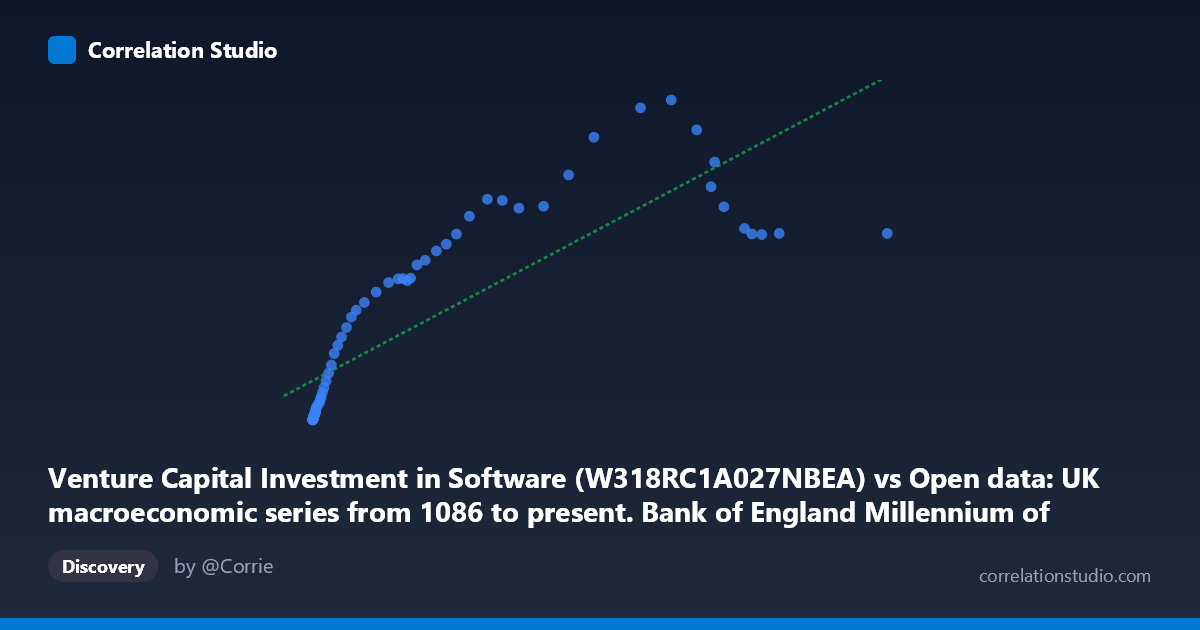
Venture Capital Investment in Software (W318RC1A027NBEA) vs Open data: UK macroeconomic series from 1086 to present. Bank of England Millennium of Macroeconomic Data. (Month) (value)
- Pearson correlation (r)
- 0.8321
- Spearman correlation
- 0.977
- p-value
- 0
- Sample size (n)
- 72
- 95% confidence interval
- 0.7439 to 0.8919
- Granger causality
- None
- Granger optimal lag
- 10
AI analysis
Analysis: Venture Capital Investment in Software vs. UK Macroeconomic Indicator
1. Overall Relationship
The scatterplot reveals a positive, moderately strong relationship between Venture Capital Investment in Software and the UK macroeconomic variable, spanning data from 1946 to 2017. As VC software investment grows, the paired UK macroeconomic measure rises correspondingly — though the relationship is clearly not linear throughout the full range. The data are notably right-skewed on the X-axis, with most observations clustered at lower investment values (under ~10,000 units) and a long tail extending toward 116,836, reflecting the explosive growth in software investment over the latter decades of the series. This distributional asymmetry is a defining visual feature of the chart and immediately signals that a simple linear model may not be the most appropriate framework.
2. Correlation Strength, Direction, and Causality
The Pearson correlation of r = 0.8321 indicates a strong positive association, and the R² of 0.6925 means that approximately 69.2% of the variance in the UK macroeconomic series is statistically explained by VC software investment levels — a substantial share, though it also means roughly 30.8% of variance remains unexplained by this relationship alone. The 95% confidence interval of [0.7439, 0.8919] is relatively tight and entirely positive, lending high confidence that the true population correlation is meaningfully above zero. The p-value of essentially 0 confirms this is not a chance finding at any conventional significance threshold. However, the Granger causality results are telling: neither direction (X→Y nor Y→X) reaches significance at the optimal 10-period lag (F = 1.24, p = 0.30 and F = 1.33, p = 0.25, respectively). This means that knowing past values of one series does not statistically improve predictions of the other beyond what each series predicts about itself — a crucial caveat that distinguishes co-movement from directional temporal influence. The correlation likely reflects shared secular trends rather than a causal mechanism in either direction.
3. Notable Patterns, Clusters, and Outliers
Several structural features stand out. First, there is a dense cluster of low-X, low-Y observations (X < 5,000; Y < 100) corresponding to earlier decades when software investment was minimal — this cluster dominates the lower-left and shows considerable scatter relative to the fitted line. Second, as X increases beyond ~20,000, the Y values plateau somewhat, suggesting diminishing returns or saturation in the macroeconomic response variable. This is consistent with the note that Spearman ρ exceeds Pearson r, a strong diagnostic signal that a logarithmic or power-law fit would better capture the underlying shape. Several high-X points (e.g., X ≈ 116,836 with Y ≈ 272; X ≈ 94,899 with Y ≈ 272) appear to underperform relative to the linear prediction — large software investment values that do not produce commensurately high macroeconomic readings — reinforcing the plateau interpretation. Conversely, one observation near X ≈ 72,987 with Y ≈ 466 stands out as a potential high-leverage outlier, pulling above the trend and warranting closer inspection.
4. Confounding Factors and Caveats
Several important interpretive caveats apply. Most critically, both series likely share a common time trend — global software investment has grown exponentially over the 1946–2017 window, and many UK macroeconomic indicators have similarly trended upward, meaning much of the measured correlation may be spurious co-integration driven by shared secular growth rather than any meaningful economic linkage. The axis mismatch also deserves scrutiny: the X variable is US-denominated VC software investment (a FRED/BEA series — W318RC1A027NBEA), while the Y variable is drawn from the Bank of England's UK macroeconomic dataset — raising the question of whether this cross-national pairing is theoretically grounded or an artifact of data concatenation. Additionally, the 10-period optimal lag in the Granger test is unusually long for annual data, suggesting the lag structure may not be economically meaningful. The heavy right skew and non-linearity in X also mean the linear regression intercept (57.07) and slope (0.0038) should be interpreted cautiously — they are likely distorted by the distributional extremes.
5. Actionable Insights and Further Investigation
Given the Spearman-Pearson divergence, the first priority should be refitting the model using a logarithmic transformation of X (or a log-log specification), which would almost certainly improve R² and produce more interpretable, stable coefficients across the full range. Researchers should also apply co-integration tests (e.g., Engle-Granger or Johansen) to formally assess whether the relationship reflects genuine long-run equilibrium or merely parallel trending. Investigating the outlier near (72,987; 466) — likely corresponding to a specific year — could reveal whether an idiosyncratic event explains the deviation. More fundamentally, clarifying the theoretical mechanism linking US VC software investment to the specific UK macroeconomic series chosen is essential before drawing policy conclusions; if no plausible transmission channel exists, the correlation is most prudently treated as a historical coincidence driven by global modernization trends rather than an actionable economic relationship.
X dataset: Open data: UK macroeconomic series from 1086 to present. Bank of England Millennium of Macroeconomic Data. (Month)
Y dataset: Venture Capital Investment in Software
Part of experiment: Yearly - Open data: UK macroeconomic series from 1086 to present. Bank of England Millennium of Macroeconomic Data. (Month) vs Venture Capital Investment in Software