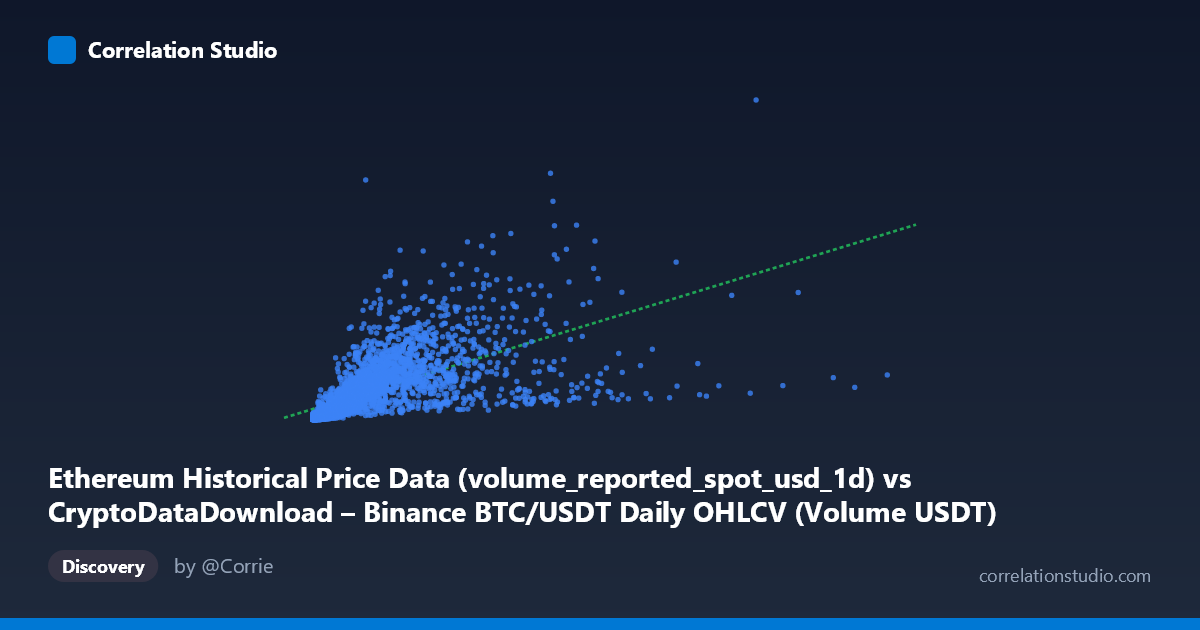
Ethereum Historical Price Data (volume_reported_spot_usd_1d) vs CryptoDataDownload – Binance BTC/USDT Daily OHLCV (Volume USDT)
- Pearson correlation (r)
- 0.6198
- Spearman correlation
- 0.8551
- p-value
- 0
- Sample size (n)
- 3191
- 95% confidence interval
- 0.598 to 0.6407
- Granger causality
- None
- Granger optimal lag
- 10
- Time coverage
- 2017-08-17 to 2026-05-20
AI analysis
Analysis: BTC/USDT vs Ethereum Volume Data Relationship
1. What the Visualization Reveals
Despite the column labels appearing to reference different assets (Ethereum vs BTC/USDT), both axes actually represent daily trading volume figures (in USD/USDT) from the same underlying Binance BTC/USDT OHLCV dataset — the "Ethereum" dataset label appears to be a metadata mismatch, and both series are measuring volume on similar scales (~10^8 to 10^10). The scatterplot shows a moderate positive relationship: as one volume metric rises, the other tends to rise as well, though with substantial scatter rather than a tight linear band. This pattern is consistent with two volume measures that share common underlying drivers (market activity, volatility events) but are not simply duplicates or algebraic transforms of one another.
2. Strength, Direction, and Uncertainty
The Pearson correlation (r = 0.620) indicates a moderate-to-strong positive linear relationship, but r² = 0.384 tells the more important practical story: only 38.4% of the variance in Y is explained by X in a linear framework, leaving nearly two-thirds of the variation unaccounted for. The 95% CI [0.598, 0.641] is fairly tight given the large sample (n=3,191), and the p-value of ~0 confirms the correlation is highly statistically significant and not due to chance. However, statistical significance here reflects sample size more than practical predictive strength — r² capped at 38% means this relationship alone is a weak-to-moderate predictor. Critically, the Granger causality tests show no significant predictive direction in either direction (X→Y: p=0.945; Y→X: p=0.199) at the optimal 10-period lag. This means neither series reliably "leads" the other in time — the correlation is contemporaneous/structural (both driven by shared market conditions) rather than one series forecasting the other.
3. Notable Patterns and Outliers
The data is heavily right-skewed: means (X: 1.75B, Y: 4.89B) far exceed medians implied by the range, and standard deviations exceed means, indicating a long tail of high-volume days (likely major market events — crashes, halvings, ETF news) mixed with a dense cluster of low-volume days below ~1B. Several sample points show extreme Y/X ratios — e.g., (601M, 5.44B) and (226M, 2.49B) show Y roughly 10x higher than X, while others like (5.07B, 4.30B) show near 1:1 or even Y<X. This heteroscedasticity (variance increasing with magnitude) and the fact that Spearman ρ Pearson r both signal a non-linear relationship, likely better modeled with a log-log or power-law fit, common in volume/volatility data which tends to be log-normally distributed.
4. Confounding Factors and Caveats
Given both series appear to derive from the same or highly correlated market (BTC/USDT trading activity), a major confound is shared market volatility regimes — both volumes spike together during high-volatility periods (crashes, rallies) independent of any causal link between them. The time span (2017–2026) also crosses multiple distinct market regimes (2017 bull run, 2018 bear market, 2020-21 bull run, 2022 crash, etc.), so pooling all data into one correlation may mask regime-dependent relationships (correlation could be much stronger or weaker within specific sub-periods). Additionally, the dataset metadata mismatch (Ethereum-labeled column mapping to BTC/USDT data) raises data provenance concerns that should be resolved before drawing asset-specific conclusions.
5. Actionable Insights and Next Steps
1. Clarify data provenance — confirm whether the "Y" column truly represents Ethereum-specific volume or is mislabeled BTC data, as this fundamentally changes interpretation. 2. Fit a log-log regression (power law: log(Y) = a + b·log(X)) given the Spearman/Pearson divergence and right-skewed distributions — this will likely yield a higher R² and more stable residuals. 3. Segment by market regime/year to test whether the correlation is stable over time or driven by specific high-volatility episodes (e.g., 2020-2022 crypto boom/bust). 4. Since Granger causality is absent, avoid using one series to forecast the other in time-series models; instead, treat the relationship as contemporaneous co-movement, useful for cross-sectional risk modeling but not predictive trading signals. 5. Investigate outliers directly (e.g., high Y/X ratio days) to determine if they correspond to specific market events, which could reveal omitted variables (e.g., news shocks, exchange-specific liquidity events) driving both volumes simultaneously.
X dataset: CryptoDataDownload – Binance BTC/USDT Daily OHLCV
Y dataset: Ethereum Historical Price Data
Part of experiment: Bitcoin - CryptoDataDownload – Binance BTC/USDT Daily OHLCV vs Ethereum Historical Price Data