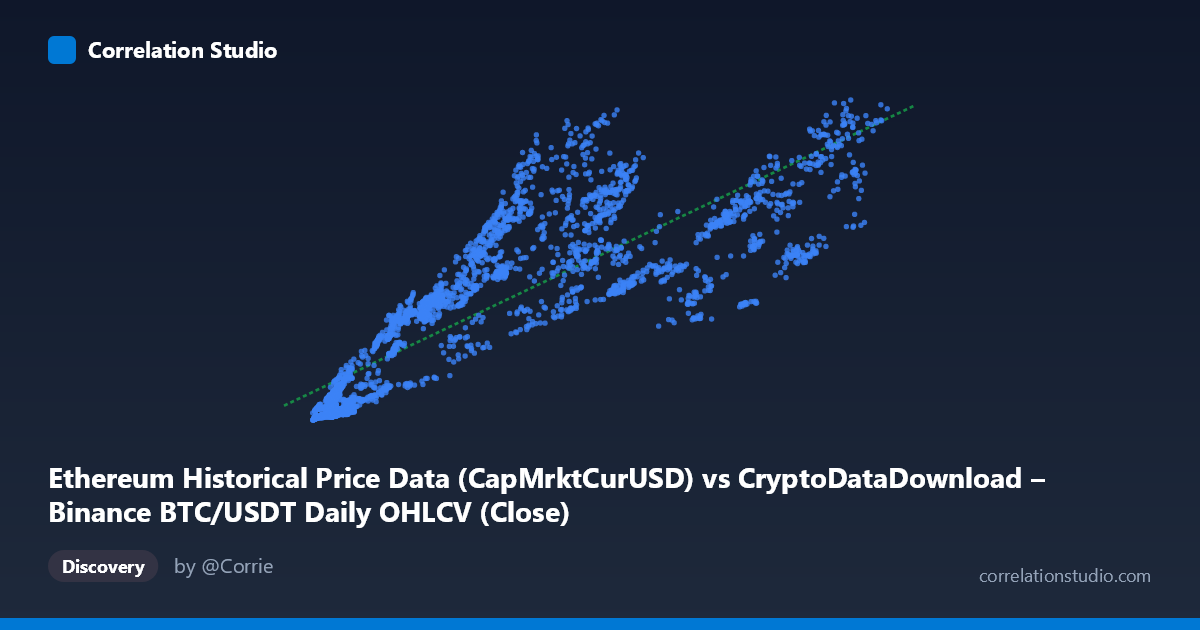
Ethereum Historical Price Data (CapMrktCurUSD) vs CryptoDataDownload – Binance BTC/USDT Daily OHLCV (Close)
- Pearson correlation (r)
- 0.848
- Spearman correlation
- 0.913
- p-value
- 0
- Sample size (n)
- 3191
- 95% confidence interval
- 0.8379 to 0.8575
- Granger causality
- None
- Granger optimal lag
- 10
- Time coverage
- 2017-08-17 to 2026-05-20
AI analysis
Analysis: Ethereum Market Cap vs. Bitcoin Price Relationship
1. What the Visualization Reveals
The scatterplot shows a strong positive relationship between Ethereum's realized/current market capitalization and Bitcoin's daily closing price on Binance. As Bitcoin's price rises through its range (~$3,189 to ~$124,659), Ethereum's market cap tends to rise correspondingly (~$8.6B to ~$584.6B). The pattern is broadly linear but with visible dispersion, particularly at mid-range Bitcoin prices, suggesting the relationship is directional but not deterministic — Bitcoin's price level provides a meaningful but incomplete signal for Ethereum's market cap.
2. Strength, Direction, and Predictive Power
The correlation coefficient (r = 0.848) indicates a strong positive linear relationship, with r² = 0.719 meaning Bitcoin price explains about 72% of the variance in Ethereum's market cap — leaving 28% attributable to other factors (ETH-specific fundamentals, altcoin cycles, DeFi/NFT activity, etc.). The tight 95% confidence interval [0.838, 0.858] and p-value of effectively 0 confirm this correlation is highly statistically robust and not a product of sampling noise, given the large sample size (n=3,191).
However, the Granger causality results are critical: neither variable shows significant predictive power over the other (BTC→ETH: p=0.723; ETH→BTC: p=0.765). This means that despite the strong contemporaneous correlation, past values of Bitcoin price do not reliably forecast future Ethereum market cap, or vice versa. Practically, this suggests both assets are likely driven by shared external factors (macro liquidity, crypto market sentiment, regulatory news) rather than one causing movements in the other with a lag. The correlation reflects co-movement, not a tradeable lead-lag relationship at the tested lag structure (10 periods).
3. Notable Patterns and Outliers
Several features stand out in the sample data: - Heteroscedasticity: Variance in Y increases substantially as X grows — at low BTC prices (~$3,000-10,000), ETH market cap clusters tightly in a lower band, but at higher BTC prices (~$60,000-110,000), the spread widens considerably (e.g., at X≈62,432 vs. X≈83,890, Y values diverge from ~$405B down to ~$219B). - Non-linear suggestion: Some low-X points show disproportionately high Y (e.g., X=10,237 → Y=102B; X=13,475 → Y=132B), hinting at periods where ETH market cap "led" or spiked independent of BTC price — possibly reflecting distinct market cycles (2017-18 ICO boom vs. 2020-21 DeFi summer). - Regime clustering: The data likely represents multiple market cycles (2017-2026) with different BTC/ETH price relationships in each era, which linear regression compresses into a single trend, potentially masking regime-specific dynamics.
4. Confounding Factors and Caveats
Major caveats apply here: - Time-series autocorrelation: Both series are highly autocorrelated (trending) financial time series. Standard Pearson r on trending data can inflate apparent correlation — much of the r² may reflect shared long-term upward drift (both assets appreciated massively from 2017 to 2025) rather than genuine synchronized short-term co-movement. - Common macro driver: Overall crypto market sentiment, USD liquidity conditions, and BTC dominance cycles likely drive both variables simultaneously, making this a classic case of confounding rather than direct causation. - Market cap vs. price mismatch: Comparing ETH market cap to BTC price (not BTC market cap) introduces a scale/units inconsistency — ETH supply growth independently inflates market cap over time regardless of price correlation. - Non-stationarity: Neither series is likely stationary; the Granger test's lack of significance may partly reflect this, and results should be interpreted cautiously without first-differencing or cointegration testing.
5. Actionable Insights and Further Investigation
- Test cointegration (e.g., Engle-Granger or Johansen test) rather than relying solely on Granger causality on levels — if BTC and ETH are cointegrated, a long-run equilibrium relationship may exist even without short-term causality. - De-trend or difference the series (e.g., use daily returns instead of price levels) and re-run correlation/Granger tests to isolate genuine short-term co-movement from shared trend. - Segment by market regime (bull/bear cycles, halving periods) to check whether the BTC-ETH relationship strength varies over time — the widening variance at high BTC prices suggests regime-dependent behavior worth modeling separately. - For practical use: Given the lack of Granger causality, this relationship should not be used for short-term predictive trading strategies (i.e., using BTC price to forecast ETH cap moves). It's better suited for long-run portfolio/beta analysis or understanding structural crypto market co-movement rather than tactical timing.
X dataset: CryptoDataDownload – Binance BTC/USDT Daily OHLCV
Y dataset: Ethereum Historical Price Data
Part of experiment: Bitcoin - CryptoDataDownload – Binance BTC/USDT Daily OHLCV vs Ethereum Historical Price Data