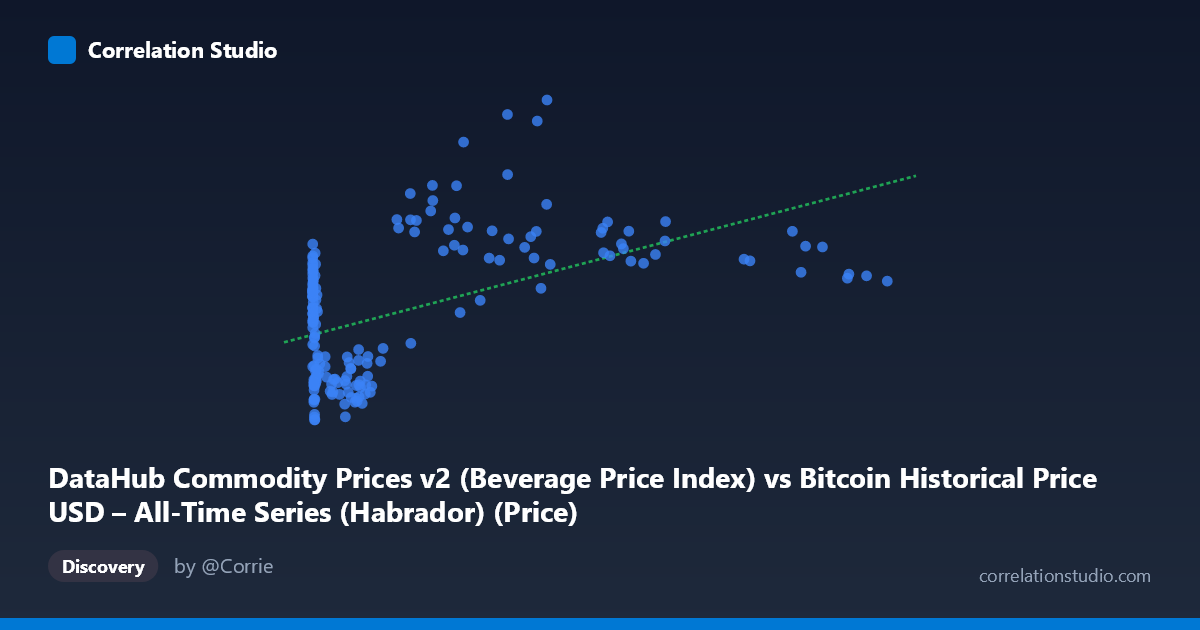
DataHub Commodity Prices v2 (Beverage Price Index) vs Bitcoin Historical Price USD – All-Time Series (Habrador) (Price)
- Pearson correlation (r)
- 0.5199
- Spearman correlation
- 0.3876
- p-value
- 0
- Sample size (n)
- 182
- 95% confidence interval
- 0.405 to 0.6185
- Granger causality
- None
- Granger optimal lag
- 1
- Time coverage
- 2010-08-01 to 2025-09-01
AI analysis
Analysis: Bitcoin Price vs. Beverage Price Index
1. Overview of the Relationship
The scatterplot shows a moderate positive association between Bitcoin's historical USD price (X-axis) and a Beverage Commodity Price Index (Y-axis). Given the massive scale disparity in X (ranging from $0.06 to $113,500, with a standard deviation of $27,080) compared to the compressed Y range (92.22 to 165.83), the data is heavily right-skewed, with the majority of points clustered at low Bitcoin prices (under $10,000) and a sparser tail extending into the tens of thousands.
2. Strength, Direction, and Statistical Confidence
The correlation coefficient (r = 0.52) indicates a moderate positive linear relationship, but the r² of 0.27 reveals that only 27% of the variance in beverage prices is explained by Bitcoin price movements — leaving 73% unexplained by this single variable. The 95% confidence interval [0.405, 0.619] is reasonably tight and entirely positive, and the p-value (5.46E-14) confirms this correlation is highly statistically significant and not due to chance. However, statistical significance should not be conflated with practical predictive power given the modest r².
Critically, the Granger causality tests show no significant predictive direction in either direction (X→Y: p=0.506; Y→X: p=0.727). This is a crucial finding: despite the contemporaneous correlation, neither variable helps forecast future values of the other. This strongly suggests the relationship is not causal in a temporal sense — it's more likely that both series are independently trending upward over the 2010–2025 window (Bitcoin due to adoption/speculation, beverage prices due to general inflation), producing a spurious correlation driven by shared time-trend behavior rather than genuine economic linkage.
3. Patterns, Clusters, and Outliers
Several structural features stand out: - Low-X cluster: A dense cluster of points where Bitcoin price is near-zero (<$1) shows beverage index values already spanning 113–130, indicating substantial Y variance unrelated to X. - Non-monotonic behavior at high X: Points like (44354, 160.99), (46281, 165.83), and (38469, 162.50) show high Y values, but (33087, 119.74) and (45092, 122.51) show much lower Y at similar X ranges — suggesting the relationship breaks down or reverses at higher Bitcoin prices, hinting at nonlinearity rather than a clean linear fit. - Heteroscedasticity: Variance in Y appears to increase at higher X values, violating a key linear regression assumption.
4. Confounding Factors and Caveats
The most significant caveat is temporal confounding via mutual trending. Both Bitcoin's price and commodity/inflation indices have risen substantially since 2010–2025, a period marked by significant macroeconomic inflation, especially post-2020. This shared upward drift over 15 years — rather than any direct market interaction between cryptocurrency and beverage commodities — likely drives the observed correlation. Additionally, the extreme scale mismatch (X spanning 6 orders of magnitude) means the linear model is dominated by a few high-leverage points; log-transforming X would likely be more appropriate and could substantially alter the r² estimate.
5. Recommendations for Further Investigation
- Detrend both series (e.g., using year-over-year differences or removing a common inflation/time trend) and re-test correlation to isolate genuine co-movement from spurious trend correlation. - Log-transform Bitcoin price given its exponential growth pattern, then re-run linear regression to check if r² improves and residual patterns normalize. - Test against a common driver (e.g., USD inflation index, M2 money supply) as a mediating variable — both series may correlate more strongly with monetary expansion than with each other. - Given the lack of Granger causality, avoid using either series to forecast the other; this correlation should not inform trading or hedging strategies between crypto and beverage commodities.
X dataset: Bitcoin Historical Price USD – All-Time Series (Habrador)
Y dataset: DataHub Commodity Prices v2
Part of experiment: Bitcoin - Bitcoin Historical Price USD – All-Time Series (Habrador) vs DataHub Commodity Prices v2