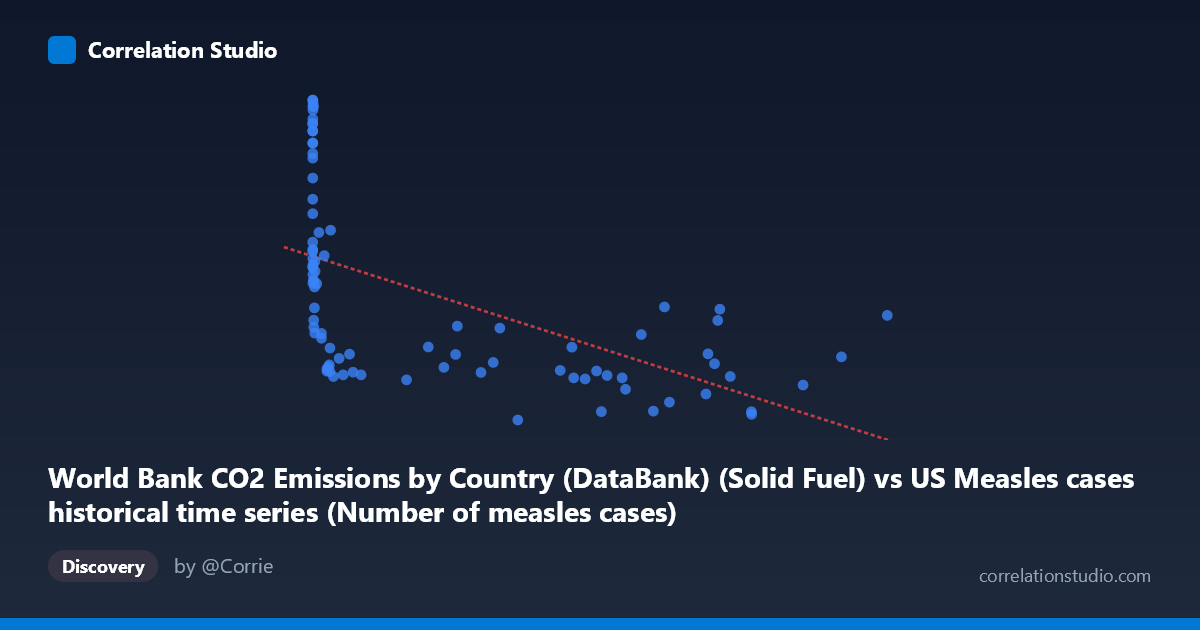
World Bank CO2 Emissions by Country (DataBank) (Solid Fuel) vs US Measles cases historical time series (Number of measles cases)
- Pearson correlation (r)
- -0.5578
- Spearman correlation
- -0.7991
- p-value
- 0
- Sample size (n)
- 87
- 95% confidence interval
- -0.6877 to -0.3934
- Granger causality
- None
- Granger optimal lag
- 10
AI analysis
Analysis: US Measles Cases vs. Solid Fuel CO2 Emissions
1. What the Visualization Reveals
The scatterplot displays a negative relationship between solid fuel CO2 emissions (X-axis, ranging from near-zero to ~894,000 units) and US measles case counts (Y-axis, ranging from ~9,555 to ~31,154). The most visually striking feature is a pronounced bifurcation in the data structure: a dense cluster of points with very low X values (below ~50,000) spans nearly the full vertical range of Y, while points with high X values (above ~200,000) are compressed into a much narrower, lower band of Y values (~9,500–17,000). This creates a pattern that is distinctly non-linear — less a diagonal line and more an L-shaped or hyperbolic curve, suggesting the relationship is driven largely by the contrast between two broad eras rather than a smooth linear decline.
2. Correlation Strength, Direction, and Statistical Framing
The Pearson r of –0.558 indicates a moderate negative correlation: as solid fuel CO2 emissions increase, US measles cases tend to decrease. However, the R² of 0.311 is a critical qualifier — only 31.1% of the variance in measles cases is statistically explained by emissions, meaning nearly 69% of the variation is attributable to other factors entirely. The 95% confidence interval for r [–0.688, –0.393] is entirely negative, confirming directional consistency, and the p-value of 1.99×10⁻⁸ makes this correlation highly statistically significant — it is extremely unlikely to be a chance finding given n = 87. That said, statistical significance here reflects the strength of a historical co-trend, not causal linkage. The Granger causality tests are both non-significant (X→Y: F = 0.80, p = 0.63; Y→X: F = 0.67, p = 0.75), meaning neither variable temporally predicts the other even at an optimal lag of 10 periods. This is a meaningful null result — it rules out lagged predictive relationships and reinforces that the correlation is likely a shared time trend artifact rather than any directional influence.
3. Notable Patterns, Clusters, and Non-Linearity
Several features stand out:
- High-Y, low-X cluster: Points with X < 50,000 show measles cases scattered widely from ~10,000 to 31,000, corresponding to the pre-vaccine era (roughly pre-1963). This cluster is highly dispersed, suggesting measles case counts in that era were volatile and driven by epidemic cycles. - Low-Y, high-X cluster: Points with X 200,000 are tightly grouped between ~9,500 and ~17,000 measles cases, corresponding to the industrial/modern era with high emissions. - Extreme outliers on Y: Values like 31,153, 30,926, 30,728, and 30,479 at very low X values represent historical measles epidemic peaks — these are genuine data points, not errors. - Non-linearity confirmed: The note that Spearman ρ Pearson r explicitly flags non-linearity. A logarithmic or power regression (log-transform of X) would almost certainly improve fit substantially, as the relationship appears to plateau at high X values. The linear slope of –0.0139 per unit is technically accurate but misleading as a descriptor of the true functional form.
4. Confounding Factors and Interpretive Caveats
This correlation is a textbook example of a spurious time-trend correlation — two variables that both changed dramatically over the 20th century but for entirely independent reasons:
- Measles vaccination (1963) is the dominant driver of declining US measles cases. The measles vaccine was introduced in 1963 and the combined MMR vaccine in 1971; this alone explains the structural break in measles cases more convincingly than any emissions relationship. - Industrial growth drove CO2 emissions upward through the 20th century for economic and energy reasons entirely unrelated to public health. - Both variables are strongly time-dependent, creating a classic omitted variable problem where "year" (or the modernization process it proxies) drives both. Without detrending or controlling for time, any correlation between them is likely spurious. - The dataset labels appear transposed in the axis descriptions (CO2 data labeled under a measles dataset and vice versa), which warrants verification of the data join integrity before drawing any conclusions. - The 93-year time span (1919–2020) means the sample is not independent observations — annual values are temporally autocorrelated, which inflates effective sample size and can produce misleadingly small p-values.
5. Actionable Insights and Further Investigation
- Apply a log transformation to X (emissions) and refit the regression — given the Spearman Pearson signal, this will likely increase R² meaningfully and provide a more honest model of the functional relationship. - Include year or a vaccination indicator as a covariate in a multiple regression to test whether the emissions-measles association survives after controlling for the primary confound (vaccine introduction). The expectation is that it largely disappears. - Detrend both series (e.g., first-differencing or HP filter) before re-running Granger causality tests to remove the shared trend that may be masking or obscuring temporal dynamics. - Segment the analysis into pre-1963 and post-1963 periods. If the correlation is driven entirely by the vaccine-era structural break, it should be substantially weaker or absent within each sub-period. - This pairing serves as a useful pedagogical example of how high statistical significance and a moderate r value can coexist with a fundamentally non-causal, confounded relationship — reinforcing why domain knowledge and causal reasoning must accompany any correlation analysis.
X dataset: US Measles cases historical time series
Y dataset: World Bank CO2 Emissions by Country (DataBank)
Part of experiment: Yearly - US Measles cases historical time series vs World Bank CO2 Emissions by Country (DataBank)