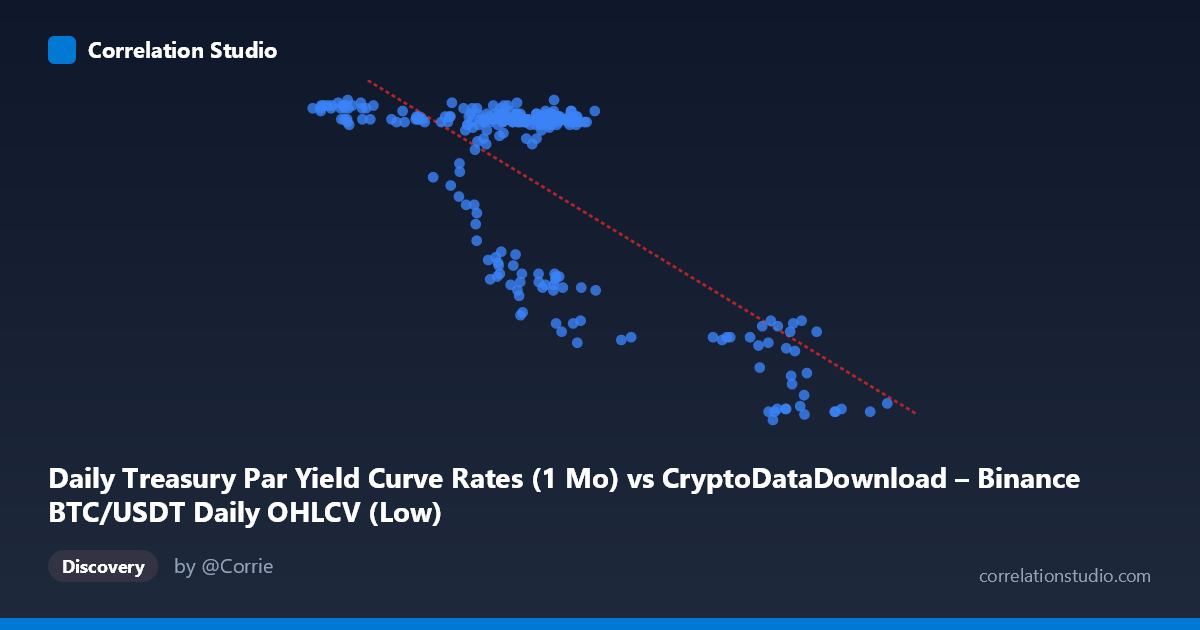
Daily Treasury Par Yield Curve Rates (1 Mo) vs CryptoDataDownload – Binance BTC/USDT Daily OHLCV (Low)
- Pearson correlation (r)
- -0.7538
- Spearman correlation
- -0.566
- p-value
- 0
- Sample size (n)
- 250
- 95% confidence interval
- -0.8028 to -0.6946
- Granger causality
- None
- Granger optimal lag
- 1
- Time coverage
- 2024-01-02 to 2024-12-31
AI analysis
Analysis: Treasury Par Yield (1 Mo) vs. BTC/USDT Daily Low
Note on axis labeling: The metadata appears swapped — the described "X-axis" (Treasury rate) actually behaves like the dependent variable in this dataset, while values in the 38,555–105,321 range with a mean of ~64,148 clearly represent BTC/USDT price levels, and the 4.40–5.56 range represents the Treasury yield. The analysis below treats X as BTC price and Y as the 1-Month Treasury Par Yield, consistent with the actual data patterns.
1. Relationship Overview The scatterplot reveals a clear negative relationship between BTC/USDT price and the 1-Month Treasury yield. As BTC prices rise from the ~40,000–70,000 range toward 90,000–105,000, the Treasury yield drops sharply from ~5.5% to ~4.4–4.7%. The bulk of the data clusters tightly in a "high price / high yield" regime (BTC ~55,000–68,000, yield ~5.4–5.5%), with a secondary, more dispersed cluster at higher BTC prices (~86,000–105,000) corresponding to yields compressed near 4.4–4.7%.
2. Strength, Direction, and Statistical Confidence The correlation coefficient (r = -0.754) indicates a strong negative linear relationship, with R² = 0.568 meaning roughly 57% of the variance in the Treasury yield is statistically associated with BTC price movements (or vice versa) — a substantial but not overwhelming share, leaving ~43% driven by other factors. The 95% CI [-0.803, -0.695] is tight and entirely negative, and the p-value ≈ 0 confirms this relationship is highly unlikely due to chance given n=250. However, the Granger causality tests are critical here: neither direction shows significant predictive power (X→Y: p=0.28; Y→X: p=0.74). This means despite the strong contemporaneous correlation, neither series helps forecast the other's future values — the relationship is likely driven by a shared underlying trend or common external driver (e.g., both responding to Fed policy expectations or macro risk sentiment) rather than one causing the other.
3. Notable Patterns The data is not uniformly distributed along a single line — it shows a two-regime structure: a dense, low-variance cluster where yields hover near 5.4–5.5% across BTC prices of 40,000–70,000, and a sparser, steeper-sloped cluster where yields fall to 4.4–4.9% as BTC exceeds 85,000. This suggests a possible threshold or regime-shift effect (e.g., a Fed rate-cutting cycle beginning once BTC crossed some level) rather than smooth linear decay. A few intermediate points (BTC ~63,000–69,000 with yields 4.7–4.9%) appear as transitional or possibly lagged observations bridging the two regimes.
4. Confounding Factors and Caveats This is almost certainly a spurious or common-cause correlation rather than a causal one. Both series are trending over the same 2024 calendar year — BTC in a bull trend and Treasury yields declining amid anticipated Fed rate cuts. Trending time series frequently produce high correlation coefficients without genuine mechanistic linkage; the lack of Granger causality supports this. Additionally, financial variables often violate the assumptions of Pearson correlation (independence, homoscedasticity) due to autocorrelation, making standard significance tests overly optimistic.
5. Recommendations Rather than treating this as a tradeable predictive relationship, it should be interpreted as two macro trends unfolding in parallel. To test genuine linkage, analysts should: (a) detrend or difference both series and re-test correlation/Granger causality on the differenced data, (b) include a third variable (e.g., Fed Funds futures, DXY, or risk-on/risk-off proxies) to check for confounding, and (c) segment the analysis by the two apparent regimes to see if the relationship is stable or a structural break. Given the absence of Granger causality, this correlation should not be used for directional forecasting.
X dataset: CryptoDataDownload – Binance BTC/USDT Daily OHLCV
Y dataset: Daily Treasury Par Yield Curve Rates
Part of experiment: Bitcoin - CryptoDataDownload – Binance BTC/USDT Daily OHLCV vs Daily Treasury Par Yield Curve Rates