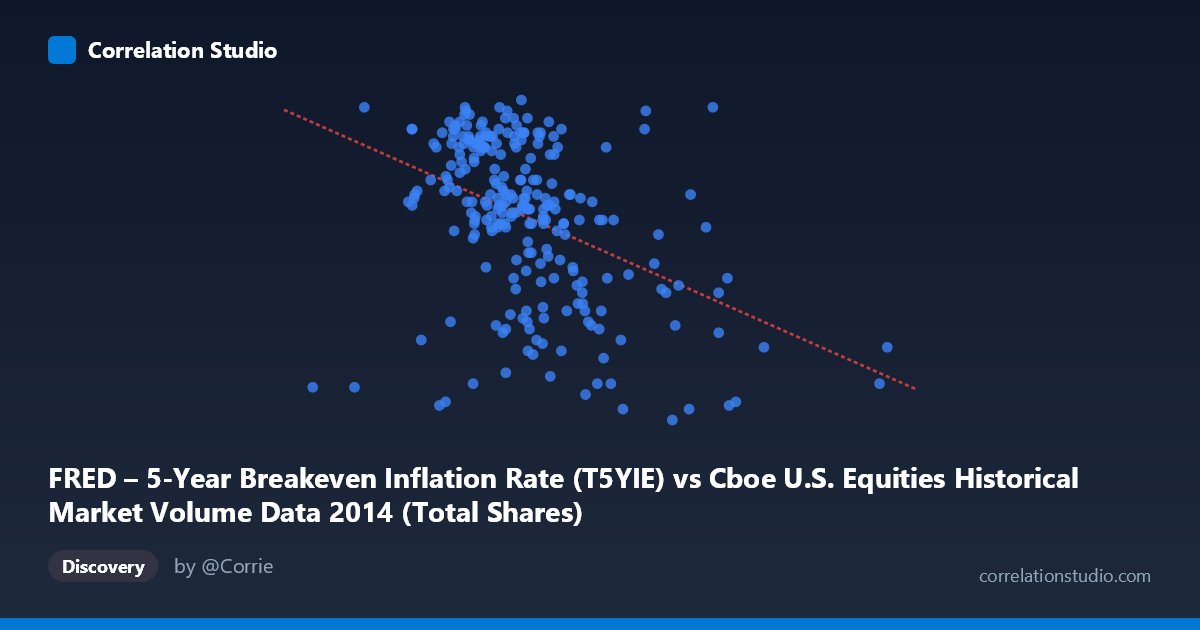
FRED – 5-Year Breakeven Inflation Rate (T5YIE) vs Cboe U.S. Equities Historical Market Volume Data 2014 (Total Shares)
- Pearson correlation (r)
- -0.4226
- Spearman correlation
- -0.4463
- p-value
- 0
- Sample size (n)
- 250
- 95% confidence interval
- -0.5195 to -0.3151
- Granger causality
- None
- Granger optimal lag
- 1
AI analysis
Scatterplot Analysis: 5-Year Breakeven Inflation Rate vs. U.S. Equities Market Volume (2014)
Relationship Overview
The scatterplot reveals a moderate negative relationship between U.S. equities market trading volume (X-axis) and the 5-year breakeven inflation rate (Y-axis) across 2014 trading days. As total share volume increases, the breakeven inflation rate tends to decline — visually expressed as a downward-sloping linear trend. The regression equation (y = -1.06×10⁻⁹x + 2.19) confirms this inverse slope, suggesting that days with substantially higher equity trading volume coincide with lower forward-looking inflation expectations. This pattern may reflect risk-off sentiment episodes: surges in trading volume often accompany market stress or volatility, periods during which inflation expectations can compress as investors seek safe assets like TIPS-adjacent instruments.
Correlation Strength and Statistical Significance
The Pearson correlation of r = -0.4226 indicates a moderate negative association, but the explanatory power is notably limited: r² = 0.1786 means only 17.9% of the variance in breakeven inflation rates is explained by trading volume. The remaining ~82% of variation is attributable to other factors entirely. The 95% confidence interval of [-0.5195, -0.3151] is meaningfully negative throughout — it does not cross zero — and the p-value of 2.975×10⁻¹² confirms the relationship is highly statistically significant given the population size of N = 3,686. However, statistical significance here is substantially amplified by the large sample; the practical effect size remains modest. Critically, Granger causality tests find no significant predictive directionality in either direction (X→Y: F = 0.253, p = 0.616; Y→X: F = 0.002, p = 0.964), meaning neither variable reliably forecasts the other in a temporal lag framework. The correlation is contemporaneous at best — not predictive.
Notable Patterns, Clusters, and Outliers
The data points cluster heavily in the volume range of ~300M–550M shares, with inflation rates concentrated between 1.7 and 2.05 — a relatively tight inflation band for typical 2014 conditions. Beyond ~600M shares, observations become sparse but consistently show depressed inflation readings (1.2–1.6), suggesting extreme volume events disproportionately occur during low-inflation-expectation regimes. Several notable outliers are visible: the point at approximately (851M shares, 1.37) is a clear extreme-volume outlier, likely corresponding to a specific high-volatility event day in late 2014. Similarly, points around (670M–680M, 1.21–1.22) represent another cluster of high-volume, low-inflation observations. On the opposite end, several low-volume days (~240M–260M shares) show elevated inflation rates near 2.03–2.05, reinforcing the inverse pattern but also suggesting a non-linear "floor" effect as inflation expectations appear bounded around 2.0%.
Confounding Factors and Interpretive Caveats
Several important confounds complicate causal interpretation. Temporal autocorrelation is a primary concern — both equity volume and inflation expectations exhibit serial dependence within a calendar year, meaning observations are not truly independent. The 2014 macro context matters enormously: the year included notable volatility events (oil price collapse in H2 2014, Federal Reserve tapering completion), which simultaneously drove volume spikes and deflation fears, creating a spurious or at least mechanically-mediated correlation. The axis labels appear swapped relative to conventional expectations (X-axis is labeled as the inflation rate dataset while Y-axis is labeled as volume, yet the data summary and regression treat volume as X), which warrants verification before drawing firm conclusions. Furthermore, breakeven inflation rates reflect bond market dynamics (TIPS spreads) driven by Treasury supply, Fed communications, and global capital flows — forces largely orthogonal to equity volume mechanics.
Actionable Insights and Further Investigation
Despite modest explanatory power, this relationship warrants structured follow-up. Segmenting the data by market regime (pre/post oil crash, pre/post Fed taper) would clarify whether the correlation is driven by a specific subperiod rather than a persistent structural relationship. Researchers should test nonlinear specifications — the apparent clustering and the possible asymptotic behavior near the 2.0% inflation ceiling suggest a polynomial or piecewise model may outperform the linear fit. Incorporating volatility measures (e.g., VIX) as a mediating variable would help test whether elevated volume and low inflation expectations are both downstream effects of risk sentiment rather than directly linked. Finally, extending the analysis to multiple years (the FRED dataset runs from 2003 to present) would reveal whether 2014 is an anomalous year or representative of a longer-term pattern between equity market activity and inflation expectations.
X dataset: Cboe U.S. Equities Historical Market Volume Data 2014
Y dataset: FRED – 5-Year Breakeven Inflation Rate
Part of experiment: Daily - Cboe U.S. Equities Historical Market Volume Data 2014 vs FRED – 5-Year Breakeven Inflation Rate