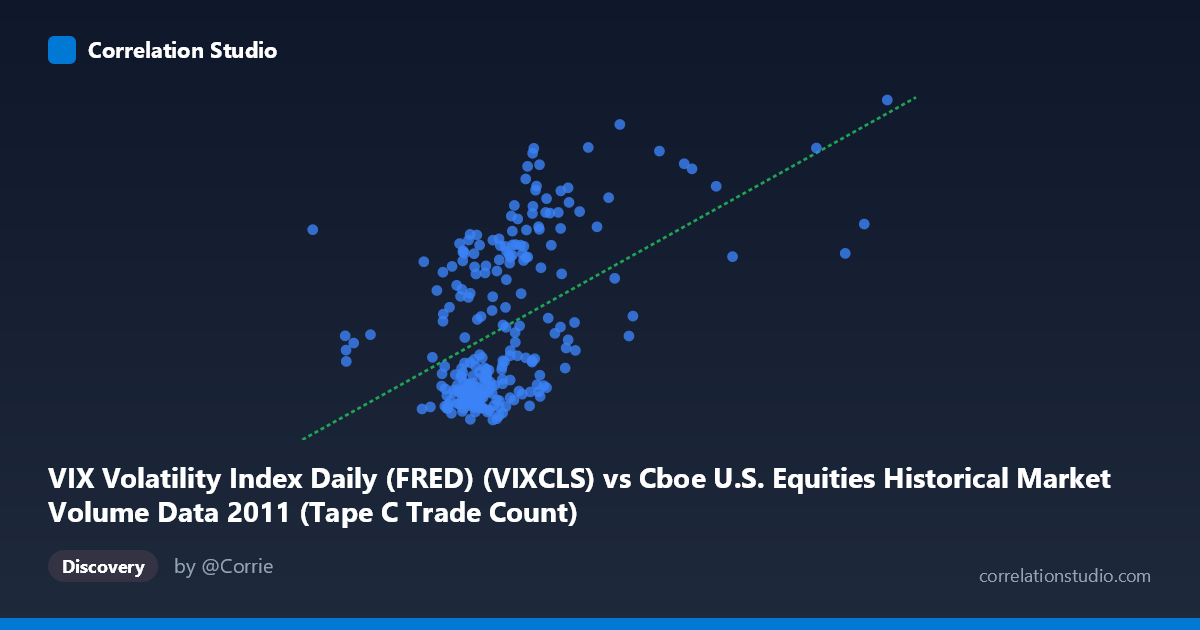
VIX Volatility Index Daily (FRED) (VIXCLS) vs Cboe U.S. Equities Historical Market Volume Data 2011 (Tape C Trade Count)
- Pearson correlation (r)
- 0.4963
- Spearman correlation
- 0.4738
- p-value
- 0
- Sample size (n)
- 252
- 95% confidence interval
- 0.3971 to 0.5841
- Granger causality
- None
- Granger optimal lag
- 1
AI analysis
Analysis: VIX Volatility Index vs. Cboe Tape C Trade Count (2011)
Relationship Overview The scatterplot reveals a moderate positive relationship between the VIX Volatility Index and Cboe Tape C trade counts during 2011. As VIX values rise — indicating heightened market fear and implied volatility — the number of trades on Tape C exchanges tends to increase. This is intuitive: periods of market stress typically drive elevated trading activity as investors reposition, hedge, or react to rapidly changing conditions. The linear regression equation (y = 3.33×10⁻⁵x + 5.95) confirms this upward slope, though the wide scatter around the regression line immediately signals that the relationship is far from deterministic.
Correlation Strength and Statistical Significance The Pearson correlation of r = 0.4963 indicates a moderate positive association, but the explanatory power is meaningfully limited: r² = 0.2463, meaning only about 24.6% of the variance in Tape C trade counts is explained by VIX levels. The remaining ~75% of variation stems from other factors entirely. The 95% confidence interval of [0.397, 0.584] is reassuringly tight and does not include zero, and the p-value of essentially 0 across N = 3,780 confirms this is not a chance finding. However, statistical significance here is partly a product of large sample size — practical significance is more modest. Critically, the Granger causality tests find no significant predictive directionality in either direction (X→Y: F = 0.099, p = 0.753; Y→X: F = 0.008, p = 0.930), meaning that past VIX values do not reliably predict future trade counts, and vice versa. The correlation is contemporaneous rather than predictive.
Notable Patterns and Outliers Several features stand out in the data. There appears to be a dense cluster of points at lower VIX values (~14–22) with relatively low and tightly grouped trade counts, suggesting a "calm market" regime where trading volume is somewhat stable regardless of modest volatility fluctuations. However, once VIX crosses approximately 30–35, trade counts show much wider dispersion and generally higher values, suggesting a non-linear or threshold-like regime shift rather than a clean linear relationship. Notable high-leverage outliers exist — particularly one point near VIX ~42–45 with very high trade counts (~921,000), which likely corresponds to the August 2011 U.S. debt ceiling crisis and S&P credit downgrade, one of the most volatile market episodes of that year. These outlier events may be disproportionately driving the overall correlation coefficient.
Confounding Factors and Caveats Several important caveats apply. First, 2011 was not a typical year — it included the European sovereign debt crisis, the U.S. debt ceiling standoff, and the Japanese earthquake, all of which compressed high-volatility and high-volume events into specific windows, potentially inflating the measured correlation versus a multi-year sample. Second, Tape C trade counts reflect a specific exchange subset (primarily NYSE Arca and related venues), so structural changes in market share, maker-taker fee adjustments, or HFT activity patterns during 2011 could independently influence volume irrespective of VIX. Third, the zero Granger causality result at lag-1 warns against assuming any causal link — both variables may be simultaneously driven by common underlying news events or macro shocks, making this a classic case of spurious correlation through a shared external driver.
Actionable Insights and Further Investigation Practitioners should avoid using VIX alone as a predictive signal for Tape C volume, given the Granger causality failure and modest r². More productive next steps would include: (1) testing non-linear models (e.g., piecewise regression with a breakpoint around VIX = 28–30) to capture the apparent regime-switching behavior; (2) expanding the time window beyond 2011 to test whether this correlation holds across different volatility regimes; (3) controlling for confounders such as day-of-week effects, options expiration dates, and Federal Reserve announcement days; and (4) examining whether other VIX-adjacent variables (e.g., VIX term structure, realized volatility, or credit spreads) improve explained variance. The correlation is real and directionally sensible, but its practical utility for forecasting or trading strategy development requires substantially richer modeling.
X dataset: Cboe U.S. Equities Historical Market Volume Data 2011
Y dataset: VIX Volatility Index Daily (FRED)
Part of experiment: Daily - Cboe U.S. Equities Historical Market Volume Data 2011 vs VIX Volatility Index Daily (FRED)