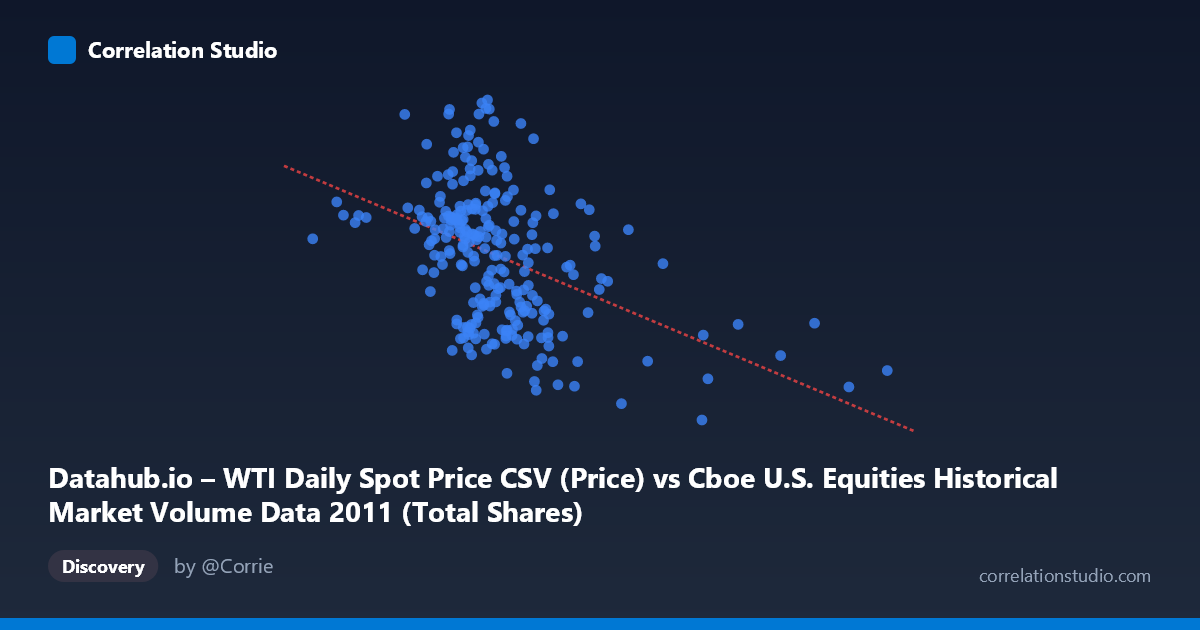
Datahub.io – WTI Daily Spot Price CSV (Price) vs Cboe U.S. Equities Historical Market Volume Data 2011 (Total Shares)
- Pearson correlation (r)
- -0.4384
- Spearman correlation
- -0.4479
- p-value
- 0
- Sample size (n)
- 252
- 95% confidence interval
- -0.5331 to -0.3328
- Granger causality
- None
- Granger optimal lag
- 1
AI analysis
Analysis: WTI Oil Price vs. U.S. Equity Market Volume (2011)
Relationship Overview The scatterplot reveals a moderate negative relationship between U.S. equity market trading volume (X-axis, measured in shares) and WTI crude oil spot prices (Y-axis, in USD/barrel) across 252 paired daily observations spanning 2011. The linear regression equation (y = -2.8815×10⁻⁸x + 109.935) confirms that as equity market volume increases, oil prices tend to decline. Visually, the cloud of points slopes downward from left to right, though with considerable dispersion — suggesting the relationship is real but far from deterministic. The bulk of volume observations cluster between roughly 400–650 million shares, while oil prices span a wide band from ~75 to ~113 USD/barrel, indicating substantial day-to-day price variability even within narrow volume ranges.
Correlation Strength and Statistical Significance The correlation coefficient of r = -0.4384 indicates a moderate negative association, but the explanatory power is modest: R² = 0.1922 means only ~19.2% of the variance in WTI oil prices is explained by equity market volume, leaving roughly 80% of price variation attributable to other factors. The 95% confidence interval of [-0.5331, -0.3328] is entirely negative and reasonably tight, confirming directional consistency, while the p-value of 2.944×10⁻¹³ makes this relationship statistically unambiguous given n=252 — the correlation is almost certainly not zero. However, statistical significance here is partly a function of sample size (N=3,780 population), and the practical magnitude remains limited. Critically, the Granger causality tests show no significant predictive directionality in either direction (X→Y: F=0.115, p=0.734; Y→X: F=3.753, p=0.054), meaning that knowing yesterday's equity volume does not meaningfully help predict today's oil price, and vice versa. The Y→X result hovers near marginal significance (p=0.054), hinting weakly that oil prices may have some lagged influence on trading volumes, but this falls short of conventional thresholds and warrants caution.
Notable Patterns and Outliers Several features stand out in the point cloud. There appear to be high-volume outliers — observations exceeding 750–880 million shares (e.g., ~808M and ~879M shares) — that correspond to relatively moderate oil prices (~86–94), consistent with the negative trend but sitting far from the main cluster. These extreme volume days likely correspond to specific market events in 2011 (e.g., the U.S. debt ceiling crisis in August or European sovereign debt turbulence). On the oil price side, values above ~108–113 USD/barrel (visible in the upper-left of the chart) occur predominantly at lower trading volumes, which could reflect the early-2011 period when oil prices spiked due to the Arab Spring while equity markets remained less frenetic. The relationship also appears to show heteroscedasticity — variance in oil prices seems wider at moderate volume levels and potentially compressed at extremes — suggesting a simple linear model may not fully capture the dynamics.
Confounding Factors and Interpretive Caveats The observed negative correlation likely reflects shared sensitivity to a common macroeconomic driver rather than a direct causal link. In 2011, periods of heightened market fear and risk-off sentiment — driven by the Eurozone crisis, U.S. credit downgrade, and global growth concerns — simultaneously depressed oil demand expectations (lowering prices) and triggered high-volume equity selling. Conversely, calmer, risk-on periods saw lower trading volumes alongside stronger oil prices. The axis labels also warrant attention: the dataset descriptions appear transposed in the notes (X is described as WTI price but labeled as market volume; Y vice versa), which could introduce confusion and should be verified against source data. Additionally, 2011 was an unusually volatile year, making these correlations potentially non-generalizable to other periods. Seasonality, OPEC decisions, USD strength, and equity index composition are all uncontrolled confounders.
Actionable Insights and Further Investigation Given that equity volume explains only ~19% of oil price variance and lacks Granger-causal predictive power, volume alone is insufficient as a trading signal for oil prices. However, the relationship's consistency (tight CI, highly significant p-value) suggests it could serve as a useful confirmatory indicator within a broader multi-factor model. Recommended next steps include: (1) controlling for VIX or a risk-sentiment index to test whether the correlation largely disappears once fear/risk appetite is accounted for; (2) extending the time series beyond 2011 to assess whether this negative relationship holds across different market regimes; (3) testing non-linear models (e.g., regime-switching or quantile regression) given the apparent heteroscedasticity; and (4) revisiting Granger causality at longer lags (beyond lag-1) since oil market dynamics often unfold over days to weeks rather than overnight. The marginal Y→X Granger result (p=0.054) also merits re-examination with a larger sample or alternative lag structures.
X dataset: Cboe U.S. Equities Historical Market Volume Data 2011
Y dataset: Datahub.io – WTI Daily Spot Price CSV
Part of experiment: Daily - Cboe U.S. Equities Historical Market Volume Data 2011 vs Datahub.io – WTI Daily Spot Price CSV