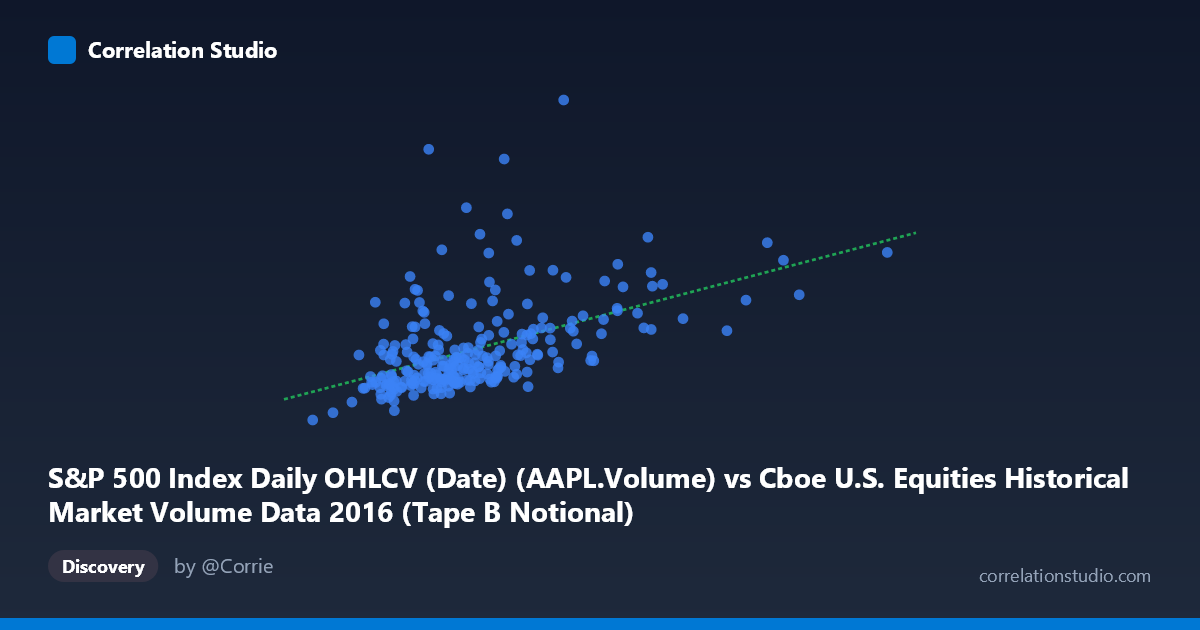
S&P 500 Index Daily OHLCV (Date) (AAPL.Volume) vs Cboe U.S. Equities Historical Market Volume Data 2016 (Tape B Notional)
- Pearson correlation (r)
- 0.4933
- Spearman correlation
- 0.534
- p-value
- 0
- Sample size (n)
- 252
- 95% confidence interval
- 0.3937 to 0.5814
- Granger causality
- None
- Granger optimal lag
- 10
AI analysis
Scatterplot Analysis: AAPL Volume vs. Cboe Tape B Notional (2016)
1. Overall Relationship The scatterplot reveals a moderate positive relationship between Apple's daily trading volume on the S&P 500 (X-axis) and Cboe U.S. Equities Tape B Notional value (Y-axis) across 252 trading days in 2016. The linear regression equation (y = 0.00540x + 11,155,100) confirms that as AAPL volume increases, Tape B Notional tends to rise as well. However, the relationship is visibly noisy, with considerable vertical scatter around the regression line, particularly in the mid-range of X values (~3.5B–5.5B), suggesting that AAPL volume alone is far from a complete predictor of Tape B activity.
2. Correlation Strength and Statistical Significance The Pearson correlation of r = 0.4933 indicates a moderate positive association, but the explanatory power is limited: r² = 0.2434 means only ~24.3% of the variance in Tape B Notional is explained by AAPL volume, leaving roughly 75.7% attributable to other factors. The 95% confidence interval of [0.3937, 0.5814] is meaningfully above zero and reasonably tight given n = 252, lending confidence that the relationship is genuine rather than a statistical artifact. The p-value of effectively 0 confirms the result is highly statistically significant. However, Granger causality analysis tells a different story temporally: neither direction (X→Y or Y→X) reaches significance (F = 1.63, p = 0.10 and F = 0.97, p = 0.47 respectively), meaning that past values of AAPL volume do not reliably predict future Tape B Notional, and vice versa. In practical terms, the two series move together but neither leads the other in a predictive temporal sense.
3. Notable Patterns, Clusters, and Outliers Several features stand out in the data: - A dense cluster forms in the X range of ~3.0B–5.5B and Y range of ~20M–55M, representing typical trading days. This core cluster drives the bulk of the correlation signal. - Prominent outliers are visible at the upper end — most notably the point near (6.71B, 133.4M) and another around (4.90B, 92.3M) and (4.45B, 76.3M). These extreme Tape B Notional values on otherwise moderate-to-high AAPL volume days suggest episodic, event-driven spikes in Tape B activity that AAPL volume alone cannot explain. - At the high X end (~8.0B–12.7B), a handful of very high-volume AAPL days exist, but their corresponding Tape B values are only modestly elevated (~46M–52M), attenuating the slope and hinting at diminishing returns or decoupling at extreme AAPL volumes. - No strong non-linear curvature is apparent, but the heteroscedasticity (wider Y spread at moderate X values) suggests the relationship may be more complex than a simple linear model captures.
4. Confounding Factors and Caveats Several interpretive caveats apply: - Dataset label mismatch: The axis labels suggest a possible dataset swap — AAPL volume comes from the Cboe dataset, and Tape B Notional comes from the S&P 500 OHLCV dataset. This warrants verification to ensure variables are correctly attributed. - Market-wide events: Both variables are likely driven by common macro factors — earnings announcements, Federal Reserve decisions, geopolitical events — which would inflate the apparent correlation without implying a direct causal link. - Tape B composition: Tape B covers NYSE American and regional exchange-listed securities, not AAPL specifically (a Nasdaq/Tape C stock). Any correlation is therefore likely spurious co-movement driven by shared market-wide volume surges rather than a structural relationship. - Temporal autocorrelation: Daily financial time series are frequently autocorrelated, which can inflate effective sample size estimates and overstate confidence in standard p-values.
5. Actionable Insights and Further Investigation - Investigate the outlier days: The extreme Tape B Notional spikes (e.g., ~133M and ~92M) should be mapped to specific calendar dates to identify whether they coincide with known market events, earnings releases, or index rebalancing — this could explain the structural noise. - Include additional covariates: Incorporating overall market volume (e.g., SPY volume, VIX level, or total U.S. equity notional) would likely absorb much of the explained variance and clarify whether AAPL volume adds independent explanatory power beyond general market activity. - Test non-linear or regime-based models: Given the heteroscedasticity and apparent outlier clustering, a quantile regression or regime-switching model (high vs. low volatility periods) may better characterize the relationship. - Re-examine with Tape C data: Since AAPL trades on Nasdaq (Tape C), a correlation analysis between AAPL volume and Tape C Notional would be a more theoretically grounded pairing and likely yield a stronger, more interpretable relationship.
X dataset: Cboe U.S. Equities Historical Market Volume Data 2016
Y dataset: S&P 500 Index Daily OHLCV (Date)
Part of experiment: Daily - Cboe U.S. Equities Historical Market Volume Data 2016 vs S&P 500 Index Daily OHLCV (Date)