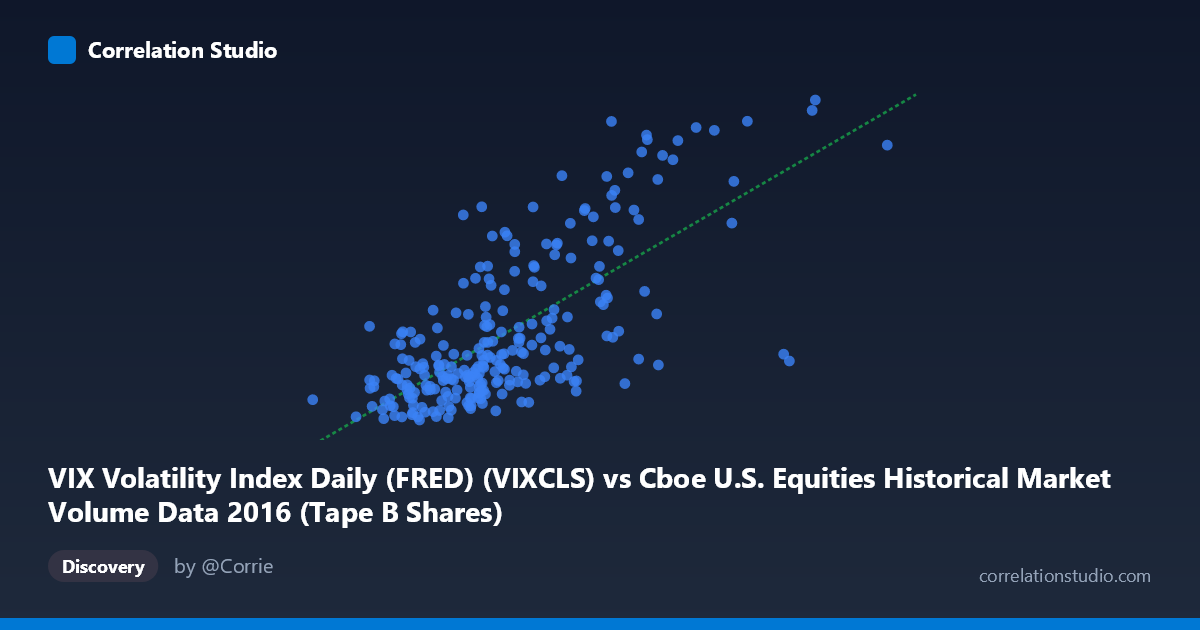
VIX Volatility Index Daily (FRED) (VIXCLS) vs Cboe U.S. Equities Historical Market Volume Data 2016 (Tape B Shares)
- Pearson correlation (r)
- 0.7051
- Spearman correlation
- 0.6568
- p-value
- 0
- Sample size (n)
- 252
- 95% confidence interval
- 0.6371 to 0.7623
- Granger causality
- None
- Granger optimal lag
- 1
AI analysis
Analysis: VIX Volatility Index vs. Tape B Share Volume (2016)
Relationship Overview The scatterplot reveals a moderate-to-strong positive relationship between Cboe U.S. Equities market volume (Tape B Shares) and the VIX Volatility Index across 252 trading days in 2016. As daily share volume increases, VIX levels tend to rise in tandem — a pattern consistent with well-established market microstructure theory: periods of heightened uncertainty and fear drive both elevated volatility readings and surging trading activity as investors reposition portfolios. The linear regression equation (y = 9.25×10⁻⁸x + 5.91) confirms a positive slope, though the intercept suggests a baseline VIX level even at minimal volume activity.
Correlation Strength and Statistical Significance The Pearson correlation of r = 0.705 indicates a meaningfully positive association, and the R² of 0.497 means that roughly 49.7% of the variance in VIX is explained by Tape B share volume — a substantial but incomplete picture, leaving ~50% of VIX variation attributable to other factors. The 95% confidence interval of [0.637, 0.762] is relatively tight given the sample size of 252, and the p-value of essentially zero confirms this correlation is highly unlikely to be a statistical artifact. However, the Granger causality results tell a more cautionary story: neither direction (X→Y: F=0.157, p=0.692; Y→X: F=0.072, p=0.788) achieves significance at an optimal lag of 1 period, meaning that neither variable reliably predicts the other the following day. The correlation, while robust cross-sectionally, does not carry meaningful temporal predictive power — a critical distinction for any trading or risk management application.
Notable Patterns, Clusters, and Outliers The scatterplot exhibits a clear dense core cluster concentrated in the X range of approximately 75M–115M shares with VIX values between 12 and 18, representing the majority of typical 2016 trading days during relatively calm market conditions. Above this cluster, a visually distinct upper-right tail emerges — roughly 10–15 observations where both volume and VIX spike dramatically (volume exceeding 130M–170M shares; VIX reaching 22–27). These likely correspond to identifiable volatility events in 2016, such as the Brexit referendum (June 23–24) and the U.S. presidential election (November 8), which generated outsized fear and volume simultaneously. One extreme outlier near (170M shares, 26.7 VIX) stands out as particularly influential and likely exerts disproportionate leverage on the regression slope. The lower-left region shows a floor effect where VIX rarely drops below ~11–12 regardless of volume compression, suggesting a natural volatility floor in calm markets.
Confounding Factors and Caveats Several important caveats apply. First, reverse causality and simultaneity are plausible — VIX itself may drive volume rather than the reverse, or both may be jointly driven by a third factor such as macroeconomic news flow or Federal Reserve announcements. Second, Tape B specifically covers NYSE American (AMEX) and regional exchange stocks, which may not perfectly represent the broad market sentiment that VIX captures (S&P 500 implied volatility), introducing a scope mismatch. Third, the failed Granger tests at lag-1 suggest the relationship is contemporaneous rather than predictive, meaning the variables respond to the same daily shocks rather than one leading the other. Finally, 2016 was an unusually event-rich year (Brexit, U.S. election, oil price recovery), and the observed correlation may not generalize to more placid years — the outlier cluster is doing meaningful statistical work in inflating r.
Actionable Insights and Further Investigation Practitioners in volatility trading or market surveillance should treat this relationship as a same-day signal rather than a forecasting tool, given the absence of Granger causality. For further investigation: (1) isolate and remove the known event-day outliers (Brexit, election day) to test whether the core correlation holds or weakens substantially — this will reveal whether the relationship is structurally robust or event-driven; (2) extend the analysis across multiple years to test temporal stability of r and R²; (3) test other tape segments (Tape A, Tape C) to determine whether the VIX-volume relationship is stronger in large-cap (S&P 500-aligned) names, which would better match VIX's underlying index; and (4) consider non-linear modeling (e.g., log-log regression or quantile regression) given the apparent heteroscedasticity visible in the upper tail, which may capture the asymmetric relationship between extreme fear episodes and volume surges more accurately than the current linear specification.
X dataset: Cboe U.S. Equities Historical Market Volume Data 2016
Y dataset: VIX Volatility Index Daily (FRED)
Part of experiment: Daily - Cboe U.S. Equities Historical Market Volume Data 2016 vs VIX Volatility Index Daily (FRED)