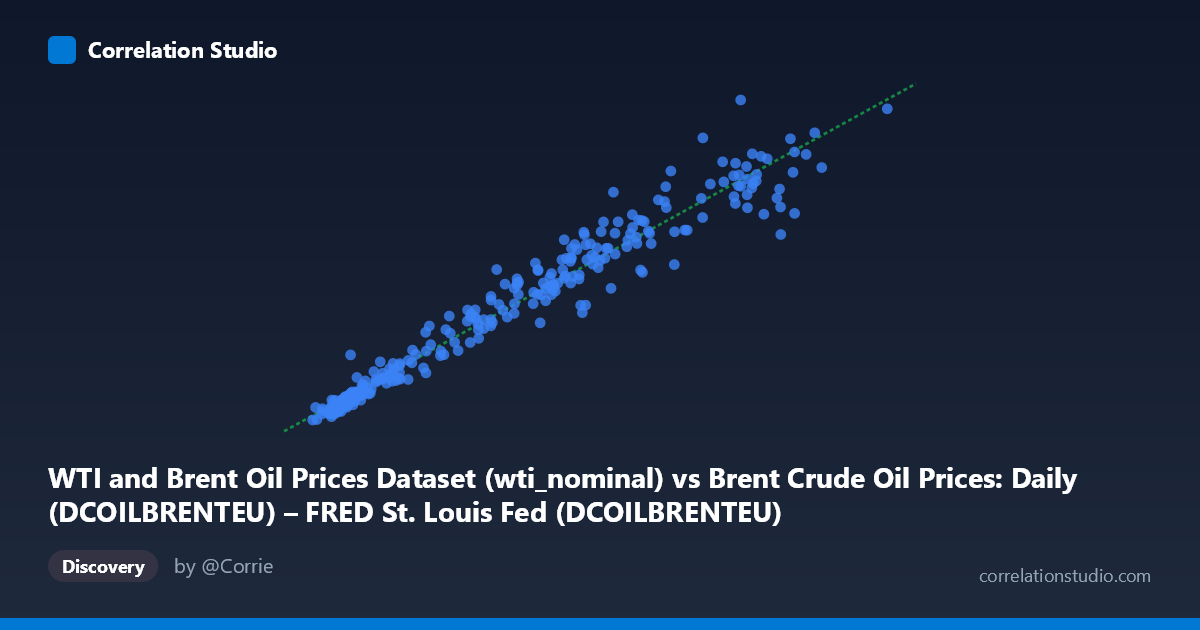
WTI and Brent Oil Prices Dataset (wti_nominal) vs Brent Crude Oil Prices: Daily (DCOILBRENTEU) – FRED St. Louis Fed (DCOILBRENTEU)
- Pearson correlation (r)
- 0.9777
- Spearman correlation
- 0.9813
- p-value
- 0
- Sample size (n)
- 295
- 95% confidence interval
- 0.972 to 0.9822
- Granger causality
- None
- Granger optimal lag
- 2
AI analysis
Analysis: WTI Nominal vs. Brent Real (CPI-Adjusted) Crude Oil Prices
1. Overall Relationship The scatterplot reveals a strikingly tight, positive linear relationship between nominal WTI crude oil prices and real (CPI-adjusted) Brent crude oil prices across nearly four decades of daily data. The regression line y = 0.870x + 5.18 fits the data closely throughout the entire price range, from low single-digit values near ~$10/barrel to highs approaching ~$130/barrel. The near-unity slope (0.87) indicates that Brent real prices track WTI nominal prices with a modest systematic discount, likely reflecting the combined effect of CPI deflation applied to Brent and the typical WTI-Brent spread dynamics. The data cloud is dense and cohesive, with no dramatic divergence from linearity across the full range.
2. Correlation Strength and Statistical Significance The correlation is exceptionally strong at r = 0.9777, with r² = 0.9559, meaning approximately 95.6% of the variance in real Brent prices is statistically explained by nominal WTI prices. The 95% confidence interval [0.9720, 0.9822] is remarkably narrow, reflecting high estimation precision across the n=295 paired observations drawn from a population of N=483, and the p-value of effectively zero confirms this relationship is not attributable to chance under any conventional threshold. However, the Granger causality results are notably inconclusive: neither direction (X→Y: F=0.58, p=0.56; Y→X: F=0.64, p=0.53) achieves statistical significance at lag-2, meaning that despite the overwhelming contemporaneous correlation, neither price series reliably predicts the other's future movements beyond what each already contains. This is a critical distinction — high correlation does not imply temporal predictive power here.
3. Patterns, Clusters, and Outliers The sample points reveal at least two distinct behavioral clusters: a dense, tightly packed cluster at low price levels (roughly $10–$35 range, corresponding to the pre-2000s and post-crash periods), and a more dispersed cluster at higher prices ($50–$130, broadly 2005–2014 and 2021–2022 periods). A handful of points show moderate deviation from the regression line — for instance, (119.57, 86.52) sits noticeably below the line, suggesting a period where nominal WTI was elevated relative to real Brent (potentially a WTI-Brent spread widening event, such as 2011 when WTI traded at an unusual discount due to Cushing storage constraints). Similarly, (61.65, 47.11) deviates downward. These outliers hint at episodic structural divergences between the two benchmarks rather than random noise.
4. Confounding Factors and Caveats Several important caveats complicate direct interpretation. First, the two variables are methodologically asymmetric: one is nominal WTI, the other is real CPI-adjusted Brent — this is comparing prices in different units of measurement (current vs. deflated dollars), which artificially suppresses Brent's apparent level relative to WTI over inflationary periods and likely contributes to the sub-unity slope. Second, WTI and Brent are physically distinct crude grades traded on different exchanges (NYMEX vs. ICE), and their spread is driven by pipeline infrastructure, regional supply-demand imbalances, and geopolitical factors that vary over time. Third, the extreme correlation likely reflects a shared underlying driver — global oil market fundamentals (OPEC policy, demand cycles, USD strength) — rather than a direct causal link between these two specific series. The Granger test's failure to find temporal directionality reinforces this interpretation.
5. Actionable Insights and Further Investigation Despite the absence of Granger causality, the tight contemporaneous relationship has practical utility: real Brent can serve as a reliable proxy for nominal WTI for cross-dataset comparisons, and the regression equation provides a reasonable conversion factor. However, analysts should monitor residuals over time — periods where actual values diverge from the regression line (as in the outliers noted above) may signal structural market dislocations worth investigating. Further work should: (1) separate the WTI-Brent spread from the CPI deflation effect by comparing nominal-to-nominal or real-to-real series for cleaner interpretation; (2) apply regime-switching or segmented regression to test whether the slope and intercept differ meaningfully across price eras (pre-2005, 2005–2014, post-2014); and (3) test Granger causality at longer lags (weekly or monthly aggregation) where information transmission between markets may be more detectable than at the daily lag-2 level used here.
X dataset: Brent Crude Oil Prices: Daily (DCOILBRENTEU) – FRED St. Louis Fed
Y dataset: WTI and Brent Oil Prices Dataset
Part of experiment: Daily - Brent Crude Oil Prices: Daily (DCOILBRENTEU) – FRED St. Louis Fed vs WTI and Brent Oil Prices Dataset