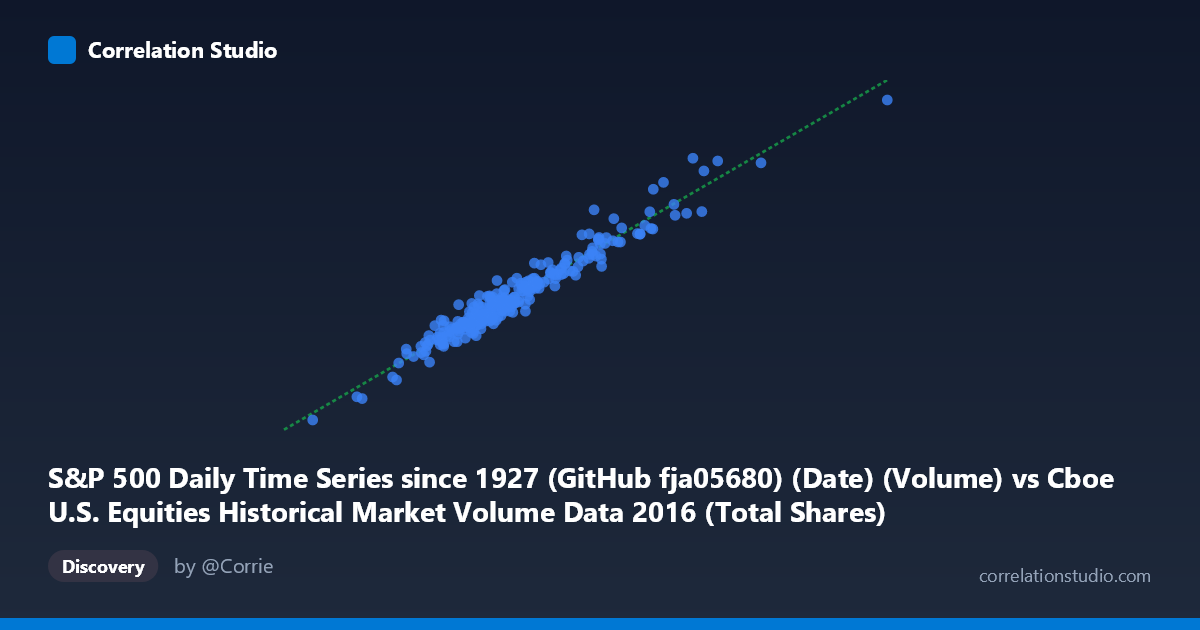
S&P 500 Daily Time Series since 1927 (GitHub fja05680) (Date) (Volume) vs Cboe U.S. Equities Historical Market Volume Data 2016 (Total Shares)
- Pearson correlation (r)
- 0.9733
- Spearman correlation
- 0.9607
- p-value
- 0
- Sample size (n)
- 252
- 95% confidence interval
- 0.966 to 0.9791
- Granger causality
- None
- Granger optimal lag
- 10
AI analysis
Analysis: S&P 500 Daily Volume vs. Cboe U.S. Equities Total Shares (2016)
Relationship Overview The scatterplot reveals a remarkably strong positive linear relationship between S&P 500 daily trading volume and Cboe U.S. Equities total shares traded across 252 trading days in 2016. As S&P 500 volume increases along the x-axis (ranging from approximately 200M to 1.09B shares), Cboe total shares tracked on the y-axis rise proportionally from roughly 1.6B to 7.6B shares. The data points cluster tightly around the regression line (y = 7.015x + 309,214,000), suggesting that for every additional share traded in the S&P 500 universe, approximately 7 total shares are recorded in Cboe's broader equity market — a ratio that likely reflects the S&P 500's substantial but partial coverage of overall U.S. equity market activity.
Correlation Strength and Statistical Significance The correlation is exceptionally strong at r = 0.9733, with r² = 0.9474 indicating that 94.7% of the variance in Cboe total shares is explained by S&P 500 volume alone. The 95% confidence interval [0.9660, 0.9791] is notably narrow, reflecting high precision in the estimate given the sample of n = 252 paired observations drawn from a population of N = 3,622. The p-value of effectively 0 eliminates any possibility of this relationship arising by chance. However, the Granger causality results complicate the picture significantly: neither direction (X→Y: F = 0.2892, p = 0.9831; Y→X: F = 0.2771, p = 0.9857) shows statistically significant temporal predictive power at the optimal 10-period lag. This means that while the two series move together almost perfectly in contemporaneous terms, neither one leads the other in a predictively useful way — they are better understood as simultaneous co-movements driven by shared underlying forces rather than as cause and effect.
Patterns, Clusters, and Outliers The sample points reveal a relatively homogeneous central cluster concentrated between approximately 400M–600M on the x-axis and 3.0B–4.5B on the y-axis, consistent with typical 2016 trading days. There are visible outliers at the high end — notably a point near (708M, 5.08B) and another approaching (1.09B range implied by the full dataset) — which likely correspond to high-volatility events such as the Brexit aftermath (June 2016) or the U.S. presidential election (November 2016), when market-wide participation surged. A point near (334M, 2.65B) represents an unusually quiet session. Importantly, even these extreme observations appear to maintain the linear relationship well, suggesting the proportional structure holds across varying market conditions.
Confounding Factors and Caveats The most critical caveat is that this correlation is almost certainly spurious in a causal sense — both variables are measuring overlapping constructs of the same underlying phenomenon: total U.S. equity market trading activity. The S&P 500 constituents account for a large fraction of Cboe-listed volume, so the two series are not truly independent. This is essentially a part-to-whole relationship, which mathematically guarantees high correlation regardless of any economic mechanism. The Granger non-causality result reinforces this interpretation. Additional confounds include shared sensitivity to macro events, seasonal trading patterns (e.g., lower volume in summer, higher around year-end), and the fact that both series are influenced by identical market microstructure factors such as options expiration dates, index rebalancing, and Federal Reserve announcements.
Actionable Insights and Further Investigation Given that the relationship is structural rather than causal, the most productive next steps would involve: (1) decomposing residuals from the regression to identify specific dates where the ratio deviates from 7:1, as these anomalies may reveal meaningful events where non-S&P-500 stocks drove unusual activity; (2) extending the time series beyond 2016 to test whether the ~7x multiplier is stable across different market regimes (e.g., 2020 meme-stock volatility or 2022 rate-shock environment); (3) introducing additional explanatory variables such as VIX levels, Fed meeting dates, or sector rotation indicators to explain residual variance in the remaining ~5.3%; and (4) exploring whether intraday volume patterns show similarly tight coupling or whether the aggregation to daily frequency masks lead-lag dynamics that Granger causality could not detect at this temporal resolution.
X dataset: Cboe U.S. Equities Historical Market Volume Data 2016
Y dataset: S&P 500 Daily Time Series since 1927 (GitHub fja05680) (Date)
Part of experiment: Daily - Cboe U.S. Equities Historical Market Volume Data 2016 vs S&P 500 Daily Time Series since 1927 (GitHub fja05680) (Date)