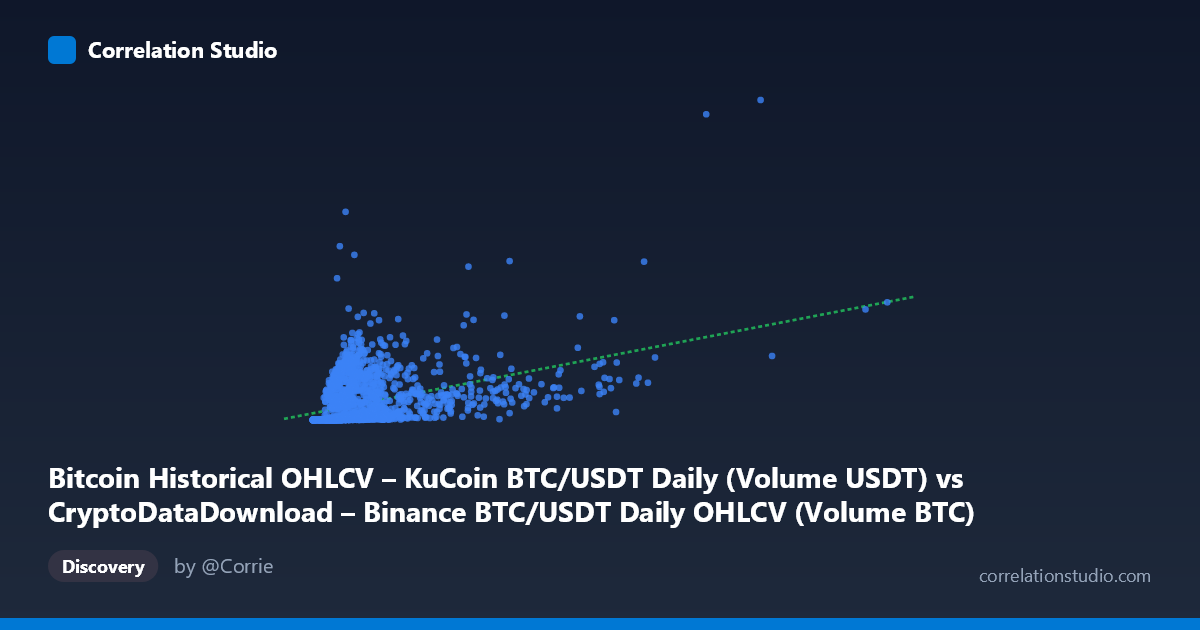
Bitcoin Historical OHLCV – KuCoin BTC/USDT Daily (Volume USDT) vs CryptoDataDownload – Binance BTC/USDT Daily OHLCV (Volume BTC)
- Pearson correlation (r)
- 0.4078
- Spearman correlation
- 0.5905
- p-value
- 0
- Sample size (n)
- 1861
- 95% confidence interval
- 0.3692 to 0.445
- Granger causality
- None
- Granger optimal lag
- 10
- Time coverage
- 2017-10-19 to 2022-11-29
AI analysis
Analysis: BTC/USDT Volume Correlation (Binance vs. KuCoin)
1. Overview of the Relationship
This scatterplot compares daily trading volume for the same asset pair (BTC/USDT) across two different exchanges — Binance (X-axis, volume in USDT) and KuCoin (Y-axis, volume in BTC). A positive but moderate relationship is visible: as Binance volume increases, KuCoin volume tends to increase as well, but with substantial scatter. The data is heavily right-skewed — most points cluster in the lower-left region (X < 100,000, Y < 500 million), with a long tail of high-volume days extending toward the upper right. This skew is expected given that trading volume, volatility, and market activity cluster around occasional high-activity events (news, crashes, rallies) rather than following a normal distribution.
2. Strength, Direction, and Statistical Confidence
The Pearson correlation (r = 0.408) indicates a moderate positive linear relationship, but r² = 0.166 reveals that only ~16.6% of the variance in KuCoin volume is explained by Binance volume — meaning over 83% of the variation is driven by other factors (exchange-specific liquidity, user base, fee structures, regional demand, etc.). The 95% CI [0.369, 0.445] is fairly tight given the large sample (n=1,861), and the p-value ≈ 0 confirms the correlation is statistically significant and not due to chance. However, statistical significance here reflects sample size more than practical strength — a moderate r with a very large n will almost always be "significant."
Critically, the Granger causality test shows no predictive temporal relationship in either direction (X→Y: p=0.427; Y→X: p=0.660). This means past Binance volume does not help forecast future KuCoin volume, and vice versa. The correlation is therefore best interpreted as contemporaneous co-movement (both exchanges reacting simultaneously to the same external market conditions — e.g., BTC price volatility, macro news) rather than one exchange leading or driving the other.
3. Patterns, Outliers, and Non-linearity
The data shows a classic "fan" or cone shape: variance in Y increases dramatically as X increases (heteroscedasticity), which violates a core assumption of simple linear regression and inflates uncertainty at higher volumes. Several notable outliers exist — e.g., (64880, 561.7M) and (52462, 352.8M) show very high KuCoin volume relative to modest Binance volume, while points like (380512, 209M) show high Binance volume without proportionally high KuCoin volume. The note that Spearman ρ exceeds Pearson r is important: it suggests the relationship is monotonic but non-linear, likely better modeled with a log-log or power-law transformation, which is standard practice for volume/volatility data spanning multiple orders of magnitude.
4. Confounding Factors and Caveats
Several confounds likely inflate or distort this correlation: - Common market driver: Both variables likely respond to the same underlying BTC price volatility and global sentiment (news, regulatory events, macro shocks), creating spurious co-movement without direct causal linkage between exchanges. - Unit mismatch: X is in USDT (quote currency) while Y is in BTC (base currency) — comparable only after adjusting for BTC price at each timestamp, which itself varied enormously (2017–2022) and could introduce scale-dependent artifacts. - Time-series autocorrelation: Daily volume data is highly autocorrelated; Pearson r and even Granger tests can be distorted by non-stationarity (trends, volatility clustering) unless the series are differenced or log-transformed first. - Exchange-specific effects: Listing changes, API outages, wash trading, or liquidity migrations on either exchange could create artificial spikes unrelated to genuine market-wide activity.
5. Recommendations for Further Investigation
1. Log-transform both axes and re-run correlation/regression — given the skew and Spearman/Pearson gap, a log-log model will likely fit substantially better and yield a more interpretable elasticity-style coefficient. 2. Convert to common units (e.g., both in USD notional) to remove BTC-price-driven scaling effects before comparing volumes. 3. Test stationarity and difference the series (e.g., % daily change in volume) before re-running Granger causality — raw non-stationary series can mask or distort lead-lag relationships. 4. Segment by market regime (bull/bear/high-volatility periods) to check if the correlation strengthens during stress events, which is common in crypto markets. 5. Since no Granger causality was found, treat this as a correlational, not predictive, relationship — useful for cross-exchange volume benchmarking or anomaly detection (e.g., flagging days with unusual divergence), but not for forecasting one exchange's volume from the other.
X dataset: CryptoDataDownload – Binance BTC/USDT Daily OHLCV
Y dataset: Bitcoin Historical OHLCV – KuCoin BTC/USDT Daily
Part of experiment: Bitcoin - CryptoDataDownload – Binance BTC/USDT Daily OHLCV vs Bitcoin Historical OHLCV – KuCoin BTC/USDT Daily