Cboe U.S. Equities Historical Market Volume Data 2010 (Tape B Shares) vs Brent Daily Spot Prices (Price)
- Pearson correlation (r)
- -0.4685
- Spearman correlation
- -0.4905
- p-value
- 0
- Sample size (n)
- 252
- 95% confidence interval
- -0.5597 to -0.3661
- Granger causality
- None
- Granger optimal lag
- 10
AI analysis
Scatterplot Analysis: Brent Crude Oil Prices vs. Cboe Tape B Trading Volume (2010)
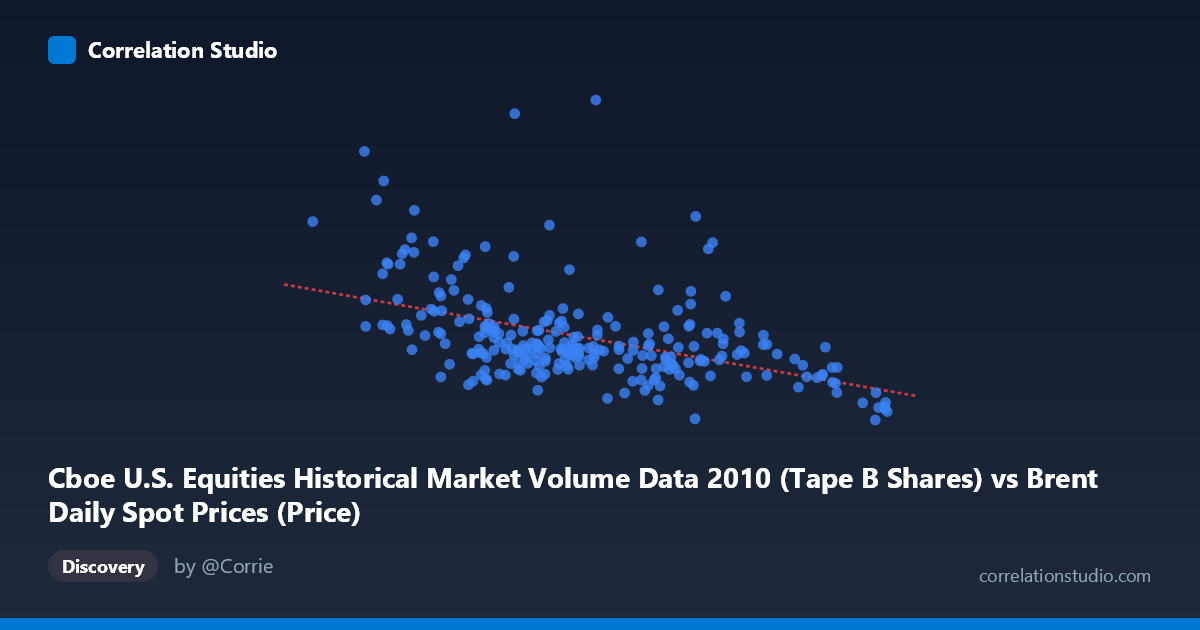
Relationship Overview The scatterplot reveals a moderate negative relationship between Brent crude oil spot prices (X-axis, in USD/barrel) and Cboe Tape B equity market share volume (Y-axis). The linear regression equation (y = -3,484,840x + 390,336,000) indicates that for every $1/barrel increase in Brent crude prices, Tape B trading volume decreases by approximately 3.48 million shares on average. While a downward trend is discernible, the scatter is substantial, with considerable dispersion around the regression line — particularly at lower price levels (roughly $67–$78/barrel) where volume variability is most pronounced.
Correlation Strength and Statistical Significance The correlation coefficient of r = -0.4685 reflects a moderate negative association, but the explanatory power is limited: r² = 0.2195 means only ~22% of the variance in Tape B trading volume is explained by Brent crude price levels, leaving roughly 78% attributable to other factors. The 95% confidence interval of [-0.5597, -0.3661] is entirely negative and does not cross zero, providing strong directional confidence. The p-value of 3.775×10⁻¹⁵ is highly significant given the sample of 252 paired observations, making it extremely unlikely this relationship is a statistical artifact. However, statistical significance here is partly a function of sample size — practical significance remains modest. Critically, Granger causality tests find no significant predictive directionality in either direction (X→Y: F=0.85, p=0.58; Y→X: F=1.11, p=0.36), meaning neither variable reliably predicts the other in temporal sequence at the optimal 10-period lag. This effectively rules out a straightforward lead-lag dynamic between these series.
Notable Patterns, Clusters, and Outliers Several features stand out in the data. First, there is a visible cluster of points in the $74–$82/barrel range with highly variable volume, suggesting this mid-range price zone is associated with the most unpredictable trading behavior. Second, several prominent high-volume outliers are evident — most notably the point near (76.48, 316,201,367) and another near (70.45, 254,988,248) — which substantially inflate variance at lower price levels and may be disproportionately influencing the regression slope. Third, at higher price levels ($85–$93/barrel), volume appears more consistently compressed and less variable, forming a tighter cluster at lower volume levels. The point at (93.63, 45,218,507) represents both the highest price and among the lowest volumes observed, anchoring the negative trend visually.
Confounding Factors and Caveats This correlation almost certainly reflects shared macroeconomic seasonality rather than a direct causal mechanism between crude oil prices and Tape B equity volume. Both series are embedded in 2010's broader economic recovery from the 2008–2009 financial crisis; Brent prices rose through the year as global demand recovered, while equity market microstructure, volatility regimes, and institutional trading calendars independently shaped Tape B volume. The dataset mismatch is also a significant caveat — Tape B covers a specific subset of U.S. equity exchanges (regional exchanges, not the primary NYSE or Nasdaq listings), which may have idiosyncratic volume dynamics unrepresentative of broader market activity. Additionally, the population size of N=3,302 versus the paired sample of n=252 suggests potential date-alignment or data-availability issues that could introduce selection bias. The absence of Granger causality further reinforces that any observed correlation is likely spurious co-movement driven by common underlying economic trends.
Actionable Insights and Further Investigation Given the limited explanatory power and absence of Granger causality, practitioners should avoid using Brent crude prices as a direct predictive signal for Tape B volume in trading or risk models. More productive avenues would include: (1) controlling for macroeconomic covariates such as VIX (volatility index), broad equity market returns, or economic surprise indices to isolate whether any residual crude-volume relationship persists; (2) testing non-linear models (e.g., threshold or regime-switching models), since the high dispersion at mid-range prices and the compressed variance at high prices suggest the relationship may be heteroskedastic and non-linear; (3) expanding the time window beyond 2010 to test whether this correlation is robust across different crude price regimes or is unique to the post-crisis recovery period; and (4) investigating the high-volume outlier dates specifically, as they likely correspond to identifiable market events (e.g., Flash Crash aftermath, earnings seasons) that, if modeled explicitly, could substantially improve explanatory power.
X dataset: Brent Daily Spot Prices
Y dataset: Cboe U.S. Equities Historical Market Volume Data 2010
Part of experiment: Daily - Brent Daily Spot Prices vs Cboe U.S. Equities Historical Market Volume Data 2010