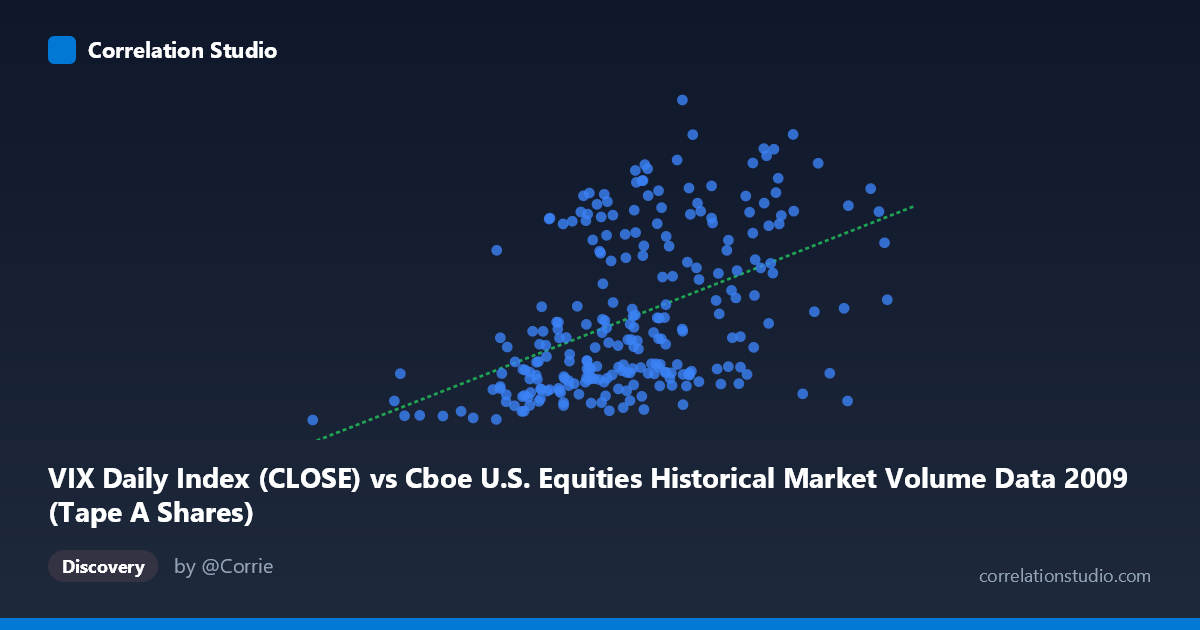
VIX Daily Index (CLOSE) vs Cboe U.S. Equities Historical Market Volume Data 2009 (Tape A Shares)
- Pearson correlation (r)
- 0.4719
- Spearman correlation
- 0.4983
- p-value
- 0
- Sample size (n)
- 252
- 95% confidence interval
- 0.3699 to 0.5627
- Granger causality
- None
- Granger optimal lag
- 1
AI analysis
Scatterplot Analysis: VIX vs. U.S. Equity Market Volume (2009)
Relationship Overview
The scatterplot reveals a moderate positive relationship between U.S. equity market trading volume (X-axis, measured in shares) and the CBOE Volatility Index close values (Y-axis). As daily trading volume increases, VIX tends to rise, which is intuitively consistent with the well-established market dynamic that heightened uncertainty and fear drive both elevated volatility readings and surges in trading activity. The linear regression equation (y = 4.37709E-08x + 12.26) confirms this upward slope, though the scatter around the regression line is visibly substantial, indicating that volume alone is far from a complete explanation of VIX behavior on any given day.
Correlation Strength and Statistical Significance
The Pearson correlation of r = 0.4719 reflects a moderate positive association, but the more informative metric here is r² = 0.2227 — meaning that variation in daily trading volume explains only about 22.3% of the variance in VIX levels. Roughly 78% of VIX variability is driven by factors entirely outside of volume. The 95% confidence interval [0.3699, 0.5627] is meaningfully wide, underscoring genuine uncertainty in the true population relationship, even with a sample of 252 paired observations drawn from a population of 3,232. The p-value of 2.22E-15 confirms the correlation is highly statistically significant — this is not a chance finding — but statistical significance should not be conflated with practical or explanatory strength. Critically, the Granger causality tests yield no significant directional predictive relationship in either direction (X→Y: F = 0.41, p = 0.52; Y→X: F = 1.07, p = 0.30), meaning that neither series meaningfully predicts the other one period ahead. The two variables move together contemporaneously but do not lead or lag each other in a temporally exploitable way.
Notable Patterns, Clusters, and Outliers
Several features stand out in the data. There is a visible cluster of points at lower volume levels (roughly 100M–400M) paired with low-to-moderate VIX readings (20–35), suggesting a baseline regime of calm, lower-activity trading days. A second, more dispersed cluster appears at higher volume ranges (450M–700M), where VIX readings span a far wider range — from below 25 to above 50 — indicating high heteroscedasticity. This fan-shaped spread at higher volumes suggests the variance in VIX is not constant across the range of X, which violates a key assumption of ordinary least squares regression. A handful of notable outliers are visible: points near (501M, 52.6) and (606M, 52.7) represent extreme high-volatility, high-volume days, likely corresponding to acute market stress episodes in early 2009 during the financial crisis trough. Conversely, (644M, 24.9) and (663M, 44.4) at similar volume levels show dramatically different VIX outcomes, reinforcing how non-deterministic the relationship is.
Confounding Factors and Caveats
Several important caveats apply. 2009 is a structurally unusual year — it spans the tail of the 2008–09 global financial crisis, the March 2009 market bottom, and the subsequent sharp recovery rally, all of which compress an extraordinary range of volatility regimes into a single calendar year. This means the observed correlation may be regime-specific and would likely not replicate in a calmer year. Additionally, both variables are plausibly driven by common third factors — major news events, Federal Reserve announcements, earnings seasons, and macro data releases simultaneously spike both volume and VIX, creating spurious co-movement that does not reflect a causal mechanism. The axis labels appear to be swapped in the dataset metadata (VIX is listed as the X-axis source but described under the Y-axis dataset label and vice versa), which warrants verification before drawing directional conclusions. Finally, aggregation of diverse exchange venues into a single volume figure may mask important intraday or venue-specific dynamics.
Actionable Insights and Further Investigation
Despite the absence of Granger causality, the contemporaneous correlation has practical relevance for risk management and liquidity modeling — traders and market makers can anticipate that unusually high-volume days are disproportionately likely to coincide with elevated implied volatility, affecting bid-ask spreads and hedging costs. For further investigation, it would be valuable to: (1) segment the data by market regime (crisis vs. recovery phases) to test whether the correlation differs across sub-periods; (2) test non-linear models (e.g., log transformation of volume) given the apparent heteroscedasticity; (3) introduce lagged variables beyond 1 period or use rolling-window correlations to detect time-varying relationships; and (4) control for macro event days (FOMC meetings, NFP releases) as categorical variables to isolate the "pure" volume-VIX relationship from event-driven co-spikes.
X dataset: Cboe U.S. Equities Historical Market Volume Data 2009
Y dataset: VIX Daily Index
Part of experiment: Daily - Cboe U.S. Equities Historical Market Volume Data 2009 vs VIX Daily Index