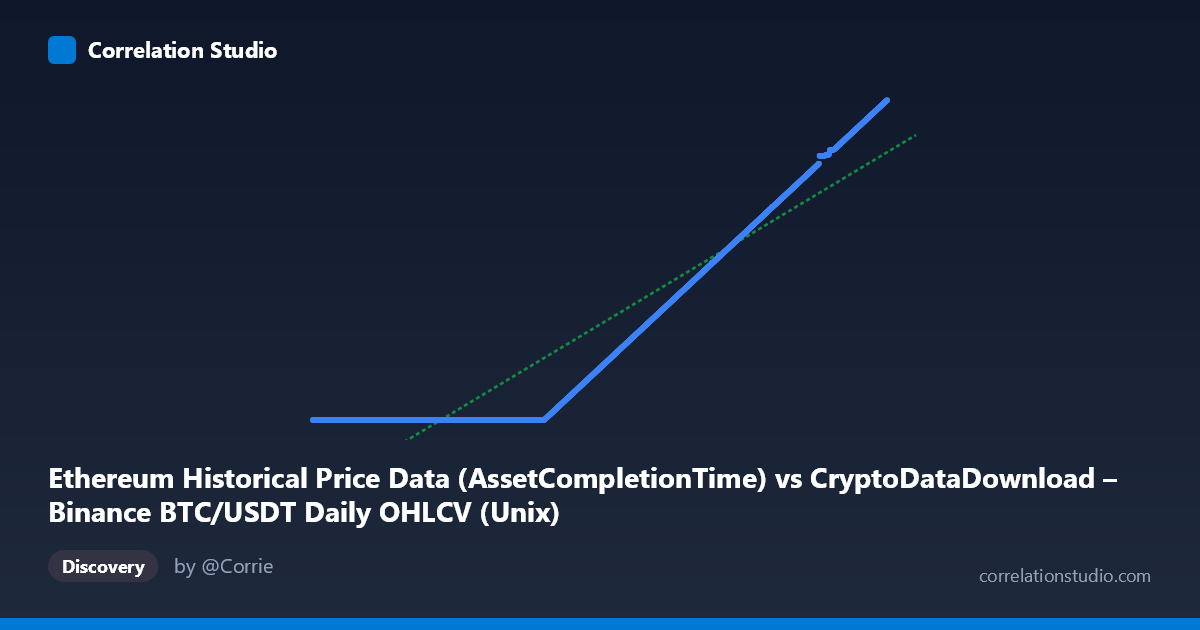
Ethereum Historical Price Data (AssetCompletionTime) vs CryptoDataDownload – Binance BTC/USDT Daily OHLCV (Unix)
- Pearson correlation (r)
- 0.9384
- Spearman correlation
- 1
- p-value
- 0
- Sample size (n)
- 3191
- 95% confidence interval
- 0.9342 to 0.9425
- Granger causality
- None
- Granger optimal lag
- 10
- Time coverage
- 2017-08-17 to 2026-05-20
AI analysis
Analysis of Variable Relationship
What the Data Actually Represents
Before interpreting the statistics, it's critical to flag a labeling anomaly: both axes appear to actually contain Unix timestamps, not price data, despite the column descriptions referencing BTC/USDT OHLCV and Ethereum metrics. The X values (~1.5–1.78 trillion) and Y values (~1.6–1.78 billion) are both consistent with millisecond/second-based Unix epoch timestamps covering 2017–2026. The sample points show Y values essentially tracking X values almost 1:1 (e.g., X=1733616000000 pairs with Y=1733715101, and X/1000 ≈ Y in most rows). This strongly suggests the "correlation" being measured is largely an artifact of two time-encoding columns of the same underlying timeline, rather than a genuine relationship between BTC price and ETH metrics.
Strength, Direction, and Statistical Confidence
Taking the reported statistics at face value: r = 0.938 indicates a very strong positive linear relationship, with r² = 0.881 meaning ~88% of the variance in Y is explained by X. The 95% CI [0.934, 0.943] is tight, and p ≈ 0 confirms this is not due to chance — with n=3,191, even modest correlations would be significant, so the near-1 correlation here is robust. However, the Granger causality tests tell a materially different story: neither direction (X→Y or Y→X) shows significant predictive power (p = 0.91 and 0.86, respectively, at 10 lags). This means that despite strong contemporaneous correlation, neither series helps forecast the other's future values — a classic signature of two variables driven by a shared underlying trend (here, most plausibly just the passage of time itself) rather than one causing or leading the other.
Notable Patterns and Outliers
The most striking feature is a plateau/floor effect: many early sample points (2018–2020, X ≈ 1.50–1.61 trillion) show Y clustered tightly around 1,614,335,xxx regardless of X — a flat, compressed band. Then, from roughly 2021 onward, Y transitions to near-linear 1:1 tracking with X. This two-regime pattern (flat region + linear region) suggests a structural break or data-quality issue — possibly a placeholder/default value used for missing early data, followed by genuine timestamp alignment once real data began. This is not a smooth, continuous linear relationship but a piecewise one, which the single r/r² figures obscure.
Confounding Factors and Caveats
The primary caveat is that this may not be a real economic relationship at all. If both columns are timestamps (possibly one in seconds, one derived with slight offset), the "correlation" mechanically approaches 1 by construction, and r²/p-values are meaningless for inference about BTC-ETH price dynamics. Even if one axis is truly price data, mixing two different assets (BTC and ETH) and two different exchanges/datasets risks conflating shared market beta (both cryptos move with overall market sentiment, BTC dominance, macro liquidity cycles) with a direct causal link. The flat early segment further suggests missing-data imputation artifacts inflating apparent linearity.
Recommendations
1. Verify column semantics — confirm whether X and Y are truly price series or mislabeled timestamp fields; check units (seconds vs. milliseconds) and look at raw values in the flat 2018–2020 segment to determine if they're placeholder/error values. 2. Segment the analysis by the apparent regime change (~2020–2021) and re-run correlation/regression separately on each segment. 3. If genuine price data, use log returns rather than levels to avoid spurious correlation from shared trends/non-stationarity, and re-run Granger causality on stationary (differenced) series. 4. Given the null Granger result, avoid using either series to forecast the other in a trading or predictive model — treat the strong r² as descriptive co-movement, not predictive power.
X dataset: CryptoDataDownload – Binance BTC/USDT Daily OHLCV
Y dataset: Ethereum Historical Price Data
Part of experiment: Bitcoin - CryptoDataDownload – Binance BTC/USDT Daily OHLCV vs Ethereum Historical Price Data