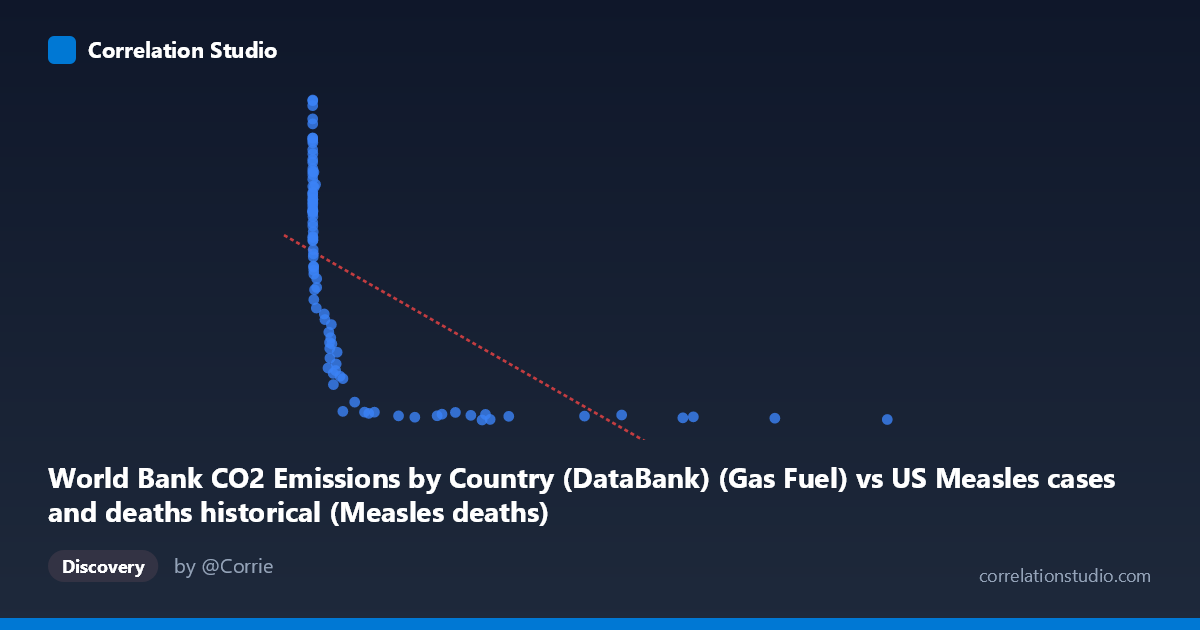
World Bank CO2 Emissions by Country (DataBank) (Gas Fuel) vs US Measles cases and deaths historical (Measles deaths)
- Pearson correlation (r)
- -0.5937
- Spearman correlation
- -0.9349
- p-value
- 0
- Sample size (n)
- 92
- 95% confidence interval
- -0.712 to -0.4428
- Granger causality
- None
- Granger optimal lag
- 10
- Time coverage
- 1919-01-01 to 2020-01-01
- Recomputed on refreshed data
- 2026-10-17 (r was -0.5937)
AI analysis
Scatterplot Analysis: Gas Fuel CO2 Emissions vs. US Measles Deaths
1. Visual Relationship Overview
The scatterplot reveals a pronounced inverse relationship between gas fuel CO2 emissions and US measles deaths, with a distinctive hyperbolic or exponential decay pattern rather than a clean linear trend. The data forms two visually distinct clusters: a dense concentration of points at very low X values (near zero) paired with high Y values (measles deaths ranging from ~7,000–17,000), and a second cluster of points at higher X values where measles deaths collapse dramatically toward near-zero. This "L-shaped" distribution is the dominant visual feature, immediately suggesting that a linear model is an approximation of what is fundamentally a non-linear, likely logarithmic or power-law relationship.
2. Correlation Strength, Direction, and Causality
The Pearson correlation of r = −0.594 indicates a moderate-to-strong negative association, with r² = 0.353 meaning that roughly 35.3% of the variance in measles deaths is statistically explained by variation in gas fuel CO2 emissions under a linear framework. While statistically highly significant (p = 4.44 × 10⁻¹⁰, far below any conventional threshold), the 95% confidence interval of [−0.712, −0.443] is notably wide, reflecting real uncertainty in the precise strength of this relationship. Crucially, the Granger causality tests show no significant predictive directionality in either direction (X→Y: F = 1.13, p = 0.359; Y→X: F = 0.58, p = 0.825), meaning that past values of gas CO2 emissions do not statistically predict future measles deaths, and vice versa. This is a critical finding: the correlation exists, but neither variable temporally "leads" the other in a predictive sense, strongly cautioning against any causal interpretation. The note that Spearman ρ exceeds Pearson r further confirms that the linear model understates the true monotonic association — a logarithmic or power transformation of X would likely produce a substantially higher explained variance.
3. Notable Patterns, Clusters, and Outliers
Several features warrant attention. First, the left-side cluster (X ≈ 0–100) shows extraordinary dispersion in Y (roughly 7,000–17,000 measles deaths), indicating that when gas fuel emissions were negligible, measles mortality was both high and highly variable — consistent with the pre-vaccine, pre-antibiotic era. Second, there is a rapid decay zone between X ≈ 100–2,000 where measles deaths plunge steeply, suggesting this middle range captures the period of dramatic public health transitions. Third, for X 2,000, deaths are essentially floored near zero with very low variance, forming a flat tail. Notable outliers include the point near (1, 16,992) — the highest recorded measles death toll — and several points in the 12,000–16,000 death range all clustered at X ≈ 0–5. On the high-emission end, (12,992, 203) and (10,450, 270) represent modern era observations where both emissions are high and deaths are near-eliminated.
4. Confounding Factors and Critical Caveats
This correlation is a classic case of confounding by a shared temporal trend — both variables are time series spanning 1919–2020, and time itself is the dominant hidden variable. Gas fuel CO2 emissions rose steadily throughout the 20th century due to industrialization and economic growth. Simultaneously, measles deaths declined precipitously due to entirely independent causes: improved nutrition and living standards in the 1920s–1940s, widespread antibiotic use reducing secondary infections from the 1940s onward, and most dramatically, the introduction of the measles vaccine in 1963, which had nothing to do with fossil fuel combustion. The absence of Granger causality reinforces this — these are two variables riding opposite sides of modernization's trajectory, correlated through time but not mechanistically linked. The dataset label confusion (CO2 data appearing in the measles dataset column and vice versa) also warrants verification of data provenance. Additionally, with N=105 total years but n=92 paired observations, ~13 missing data points could introduce sample bias particularly at the extremes.
5. Actionable Insights and Further Investigation
The most valuable next step would be to explicitly model time as a covariate — a partial correlation or multiple regression controlling for year would almost certainly eliminate or drastically reduce the observed r, testing whether any residual relationship persists. Applying a logarithmic transformation to X (log of CO2 emissions) is strongly recommended given the non-linear pattern and the Spearman Pearson signal; this would likely raise explained variance substantially and produce better-behaved residuals. Researchers should also segment the analysis into pre-vaccine (pre-1963) and post-vaccine eras to determine whether the correlation structure differs meaningfully across periods. For genuine public health modeling, measles deaths should be examined against direct intervention variables — vaccination coverage rates, healthcare access indices, and population density — rather than an industrial emissions proxy. Finally, a breakpoint or piecewise regression around 1963 (vaccine introduction) and ~1945 (antibiotic era) would reveal whether the steep decay phase is statistically localized to those transition years, which would strongly support the time-confounding interpretation over any direct relationship.
X dataset: US Measles cases and deaths historical
Y dataset: World Bank CO2 Emissions by Country (DataBank)
Part of experiment: Yearly - US Measles cases and deaths historical vs World Bank CO2 Emissions by Country (DataBank)