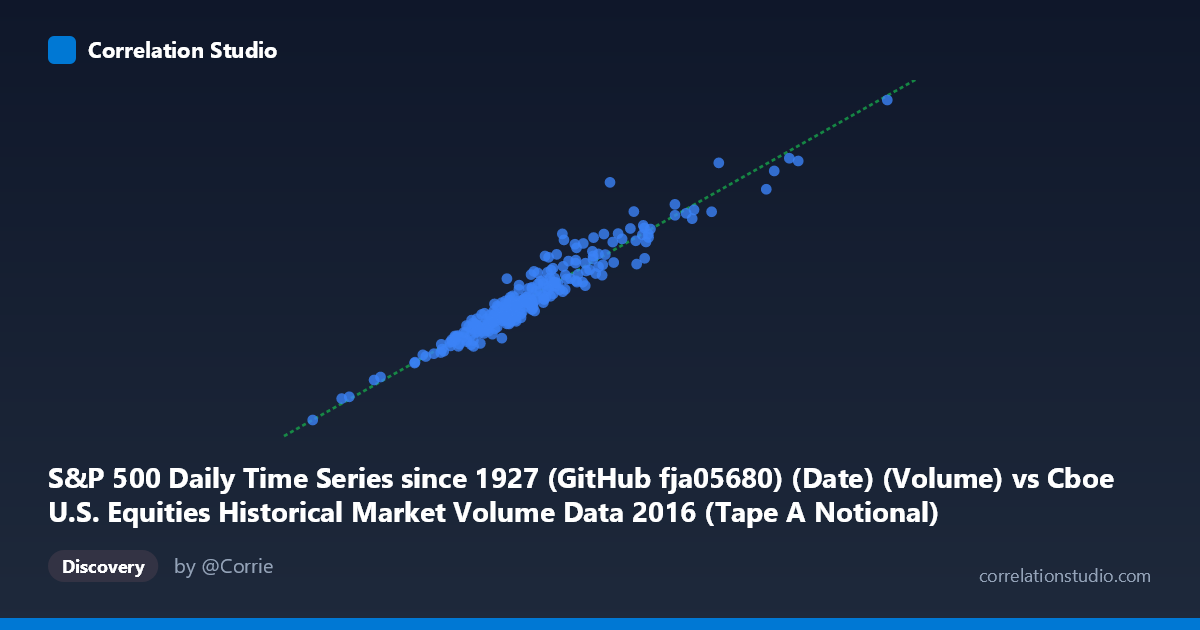
S&P 500 Daily Time Series since 1927 (GitHub fja05680) (Date) (Volume) vs Cboe U.S. Equities Historical Market Volume Data 2016 (Tape A Notional)
- Pearson correlation (r)
- 0.9603
- Spearman correlation
- 0.956
- p-value
- 0
- Sample size (n)
- 252
- 95% confidence interval
- 0.9494 to 0.9689
- Granger causality
- None
- Granger optimal lag
- 10
AI analysis
Analysis: S&P 500 Trading Volume vs. Cboe Tape A Notional Value (2016)
Relationship Overview The scatterplot reveals a remarkably strong positive linear relationship between S&P 500 daily trading volume and Cboe Tape A notional value across 2016. As daily trading volume increases, the notional value of trades on Tape A rises in near-lockstep, following the regression line y = 0.4357x − 11,114,700 closely across the observed range. This is conceptually intuitive: notional value (the dollar value of shares traded) is a direct mathematical function of volume multiplied by price, so when more shares change hands on a given day, the aggregate dollar value of those transactions scales proportionally, assuming relatively stable price levels within the year.
Correlation Strength and Statistical Significance The correlation coefficient r = 0.9603 indicates an exceptionally strong positive association, and the R² = 0.9222 means that 92.2% of the day-to-day variance in Tape A notional value is explained by trading volume alone — a remarkably high explanatory power for financial data. The 95% confidence interval [0.9494, 0.9689] is narrow, confirming this estimate is precise and stable, and the p-value of effectively 0 across n = 252 paired observations makes any chance explanation untenable. However, the Granger causality results are notably absent: neither direction (X→Y: F = 0.429, p = 0.931; Y→X: F = 0.383, p = 0.953) achieves significance at the optimal 10-period lag. This means that while volume and notional value move together contemporaneously, neither variable reliably predicts the other in advance — they are co-moving products of the same underlying market activity rather than causally linked in a temporal sequence.
Patterns, Clusters, and Outliers The data points cluster densely in the core range of approximately 7.5–10.5 billion (X) by 3.0–4.5 billion (Y), consistent with typical 2016 trading sessions. A handful of points extend into higher-volume territory (X 11 billion, Y 5 billion), likely corresponding to known high-volatility events such as the U.S. presidential election in November or post-Brexit volatility spillovers. One visible outlier cluster sits in the lower-left region (X ≈ 6.1–6.8 billion, Y ≈ 2.65–2.85 billion), suggesting unusually quiet trading sessions — possibly holiday-adjacent or summer low-activity days. The spread around the regression line appears to widen slightly at higher volume levels, hinting at mild heteroscedasticity where price level variability contributes additional noise on high-volume days.
Confounding Factors and Caveats The near-mechanistic relationship here warrants caution in interpretation: notional value is structurally dependent on volume by construction (notional ≈ shares × price), so the high R² partly reflects a tautological linkage rather than an independent empirical discovery. Average daily price levels in the S&P 500 act as a hidden scaling factor — if prices drift significantly within the year, the volume-to-notional ratio shifts, explaining residual variance around the line. The dataset also covers only calendar year 2016, a period of moderate volatility but a generally upward price trend, which limits generalizability. Additionally, Tape A covers NYSE-listed securities specifically, meaning the relationship may not hold equally for Tape B (NYSE American) or Tape C (Nasdaq) securities, and market structure changes (e.g., shifts to dark pools or off-exchange trading) could alter this relationship in other periods.
Actionable Insights and Further Investigation Given the structural nature of this relationship, practitioners should use volume as a real-time proxy for notional activity when notional data is delayed, with the caveat of adjusting for prevailing price levels. For deeper investigation, it would be valuable to: (1) incorporate average daily S&P 500 price as a third variable to decompose the residual 7.8% unexplained variance; (2) examine whether the volume-notional relationship holds consistently across different market regimes (bull vs. bear, high vs. low VIX); (3) test Granger causality at shorter intraday lags, since the 10-period daily lag may be too coarse to detect any predictive signal; and (4) compare Tape A dynamics against Tapes B and C to assess whether exchange-specific microstructure affects the slope of this relationship across market segments.
X dataset: Cboe U.S. Equities Historical Market Volume Data 2016
Y dataset: S&P 500 Daily Time Series since 1927 (GitHub fja05680) (Date)
Part of experiment: Daily - Cboe U.S. Equities Historical Market Volume Data 2016 vs S&P 500 Daily Time Series since 1927 (GitHub fja05680) (Date)