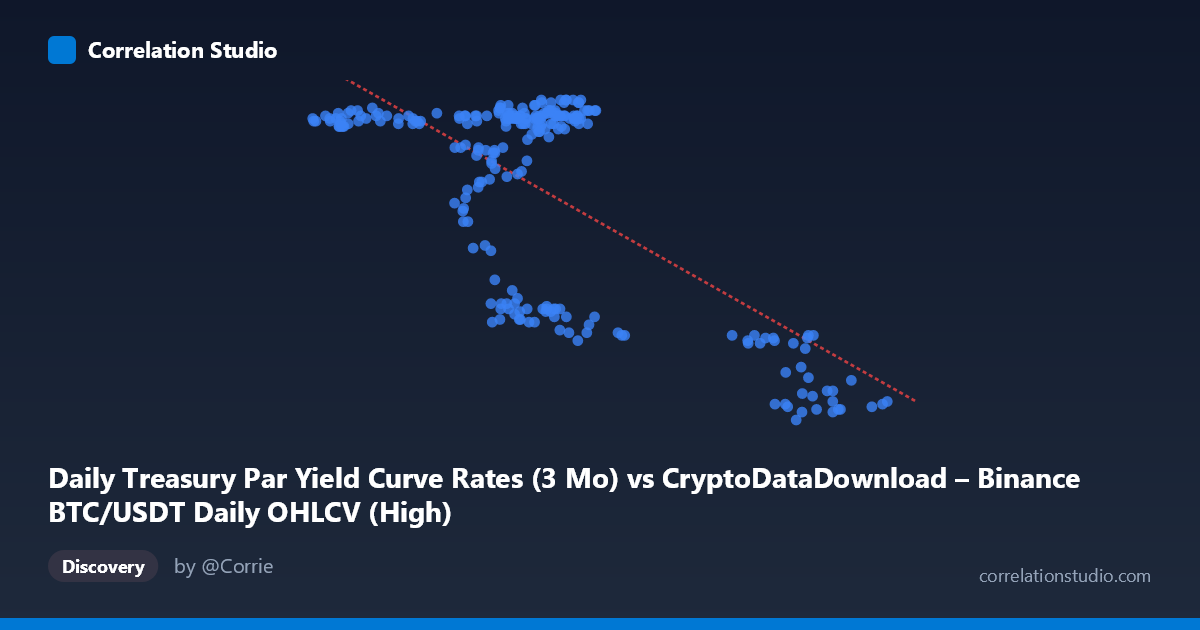
Daily Treasury Par Yield Curve Rates (3 Mo) vs CryptoDataDownload – Binance BTC/USDT Daily OHLCV (High)
- Pearson correlation (r)
- -0.6921
- Spearman correlation
- -0.3123
- p-value
- 0
- Sample size (n)
- 250
- 95% confidence interval
- -0.7517 to -0.6214
- Granger causality
- None
- Granger optimal lag
- 1
AI analysis
Analysis: Treasury 3-Month Yield vs. BTC/USDT Daily High
1. Overview of the Relationship
The scatterplot depicts a clear negative association between the 3-month Treasury par yield (X-axis) and the mislabeled "BTC/USDT High" series (Y-axis, values ranging 4.31–5.52, which — given the scale — actually appears to represent an interest-rate-like metric rather than a crypto price, suggesting a possible column-mapping mix-up in the dataset labeling). Treating the data as presented, as X increases from roughly 40,000 to 108,000, Y declines from ~5.5 toward ~4.3. The data does not scatter randomly around a single downward line; rather, it segments into two visually distinct clusters — a dense, tight cluster where X is between ~40,000–72,000 and Y sits high (5.2–5.5), and a smaller, looser cluster where X exceeds ~90,000 and Y drops sharply to 4.3–4.7.
2. Strength, Direction, and Statistical Confidence
The Pearson correlation of r = -0.692 indicates a moderately strong negative linear relationship. The r² = 0.479 means that only about 48% of the variance in Y is explained by X — meaningful, but leaving over half of Y's variability attributable to other factors or noise. The 95% CI [-0.752, -0.621] is fairly narrow and entirely negative, and the p-value ≈ 0 confirms this relationship is highly unlikely to be due to chance at n=250. However, the Granger causality tests (optimal lag = 1) show no significant predictive direction in either direction (X→Y: p=0.434; Y→X: p=0.437). This is an important caveat: despite the strong contemporaneous correlation, neither variable helps forecast the other's future values — the relationship is likely driven by a shared underlying trend or a slower-moving common factor rather than one series causally leading the other.
3. Patterns, Clusters, and Non-linearity
The most striking feature is the bimodal clustering rather than a smooth linear decay. The bulk of points cluster tightly at X≈58,000–72,000 with Y≈5.4–5.5, a second sub-cluster near X≈60,000–70,000 dips to Y≈4.6–4.8, and a distinct high-X cluster (X≈91,000–108,000) sits consistently low at Y≈4.3–4.6. This structure looks more like a step/threshold function or regime shift than a continuous linear relationship — consistent with a rate environment that stayed flat for extended periods before shifting to a new plateau (typical of Treasury yield behavior, which moves in discrete policy-driven steps rather than continuously). This strongly suggests the true relationship is non-linear (possibly logistic or piecewise), and the linear R² of 0.479 likely understates the strength of association if a regime-based or non-linear model were fit.
4. Confounding Factors and Caveats
Both series appear to be time series with strong autocorrelation (Treasury yields change slowly; the Y variable also appears to persist in plateaus), meaning the 250 "paired" observations are not independent samples — this inflates the apparent statistical significance and can produce spurious correlation driven by shared trends over the 2024 calendar year (both series may simply be trending together temporally without direct causation). Additionally, the axis labels appear swapped/mismatched (X labeled as Treasury yield but describing OHLCV, Y labeled as BTC High but showing values in a 4-5.5 range, more consistent with a yield) — this metadata inconsistency should be resolved before drawing economic conclusions. Macro factors like Fed policy decisions, inflation prints, or crypto-specific liquidity events could be common drivers behind both series' movements, rather than one directly influencing the other.
5. Suggested Next Steps
1. Verify variable labeling/units — confirm which series is actually the Treasury rate and which is the crypto-derived metric, since the current axis descriptions seem inconsistent with the value ranges shown. 2. Test for non-linear/regime models (e.g., piecewise regression, spline fitting, or clustering-based segmentation) given the visibly bimodal structure — this could substantially improve explanatory power beyond r²=0.479. 3. Difference or detrend both series before correlation testing to control for autocorrelation and reduce spurious-correlation risk from shared time trends. 4. Incorporate additional lags or exogenous macro variables (Fed funds rate changes, CPI, crypto market volume) in a multivariate model, since Granger tests show no direct lead-lag relationship between these two series alone.
X dataset: CryptoDataDownload – Binance BTC/USDT Daily OHLCV
Y dataset: Daily Treasury Par Yield Curve Rates
Part of experiment: Bitcoin - CryptoDataDownload – Binance BTC/USDT Daily OHLCV vs Daily Treasury Par Yield Curve Rates