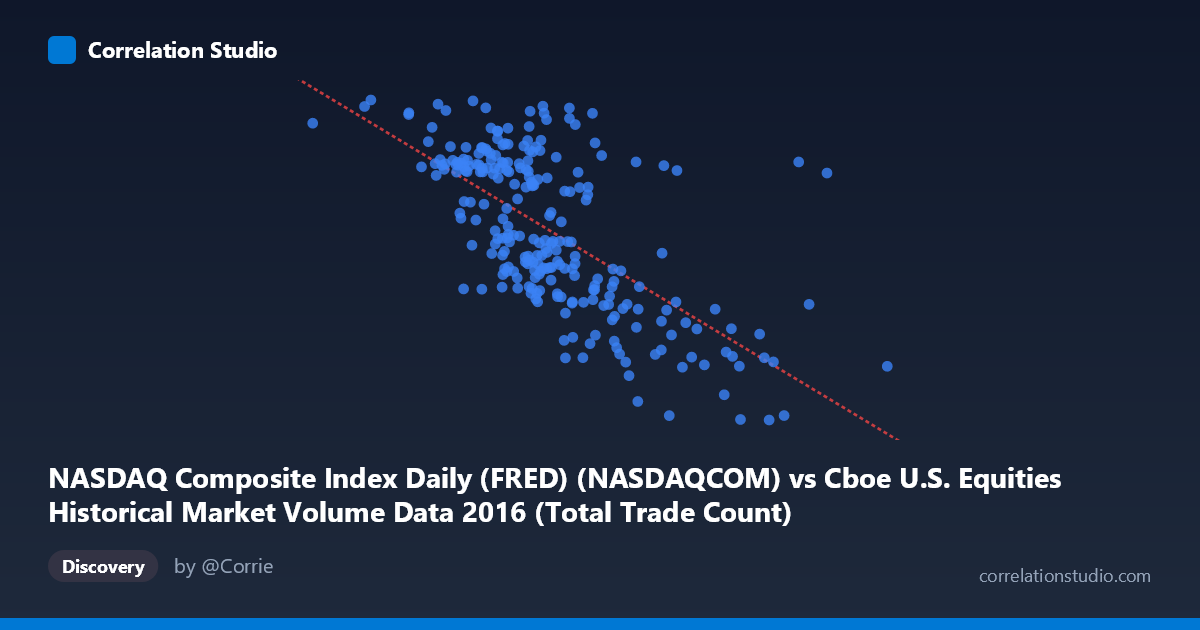
NASDAQ Composite Index Daily (FRED) (NASDAQCOM) vs Cboe U.S. Equities Historical Market Volume Data 2016 (Total Trade Count)
- Pearson correlation (r)
- -0.6588
- Spearman correlation
- -0.6607
- p-value
- 0
- Sample size (n)
- 252
- 95% confidence interval
- -0.7235 to -0.5827
- Granger causality
- None
- Granger optimal lag
- 10
AI analysis
Scatterplot Analysis: NASDAQ Composite Index vs. U.S. Equities Total Trade Count (2016)
Relationship Overview
The scatterplot reveals a negative relationship between the NASDAQ Composite Index level and the total trade count on U.S. equities exchanges throughout 2016. As the NASDAQ index rose — spanning roughly 4,266 to 5,487 across the year — daily trade counts tended to decline. This is visually expressed in a downward-sloping point cloud, consistent with the fitted regression line y = −0.000370x + 5,883.51. In practical terms, higher index values (reflecting a generally rising, calmer market) were associated with fewer individual trades being executed, while lower index readings coincided with elevated trade activity.
Correlation Strength and Statistical Framing
The Pearson correlation of r = −0.6588 indicates a moderate-to-strong negative association. The R² of 0.4341 means that approximately 43.4% of the variance in trade count is explained by the NASDAQ index level, which is substantial but leaves 56.6% attributable to other factors. The 95% confidence interval of [−0.7235, −0.5827] is notably narrow and excludes zero entirely, reflecting high precision given the sample of n = 252 paired observations drawn from a population of N = 3,622. The p-value of effectively zero confirms this association is highly unlikely to be a chance artifact. However, the Granger causality analysis tells a critical story: neither direction of temporal prediction is statistically significant (X→Y: F = 0.1035, p = 0.9998; Y→X: F = 0.3946, p = 0.9482). This means that despite a robust contemporaneous correlation, neither the index level nor trade count reliably predicts the other in a lead-lag sense — the relationship is associative, not directionally causal in the temporal domain.
Notable Patterns, Clusters, and Outliers
Several structural features are visible in the point cloud. There is a dense central cluster concentrated between roughly NASDAQ values of 2,100,000–2,500,000 (note: the X-axis appears to reflect a scaled or transformed representation) and trade counts of 4,750–5,300, suggesting the most common trading conditions in 2016. A sparse tail extends to the right (higher NASDAQ values, lower trade counts), corresponding to the latter portion of 2016's market rally with relatively thin participation by trade count. Conversely, points at the lower-left — lower index levels paired with higher trade counts — likely correspond to early 2016's volatility episode (the January–February market selloff), when elevated uncertainty typically drives higher transaction frequency. A handful of potential outliers appear at extreme Y values (trade counts near 5,450–5,487) and at very high X values (above 3,500,000), which may represent specific high-volatility or high-volume event days worth examining individually.
Confounding Factors and Interpretive Caveats
This correlation is almost certainly driven by a shared underlying temporal dynamic rather than a direct structural link between index level and trade count. Both variables evolve through time in 2016: the NASDAQ trended upward over the year while trade count may have followed its own secular trend (possibly declining as the year progressed into a low-volatility environment). This creates spurious temporal correlation — the classic confounding of two time series that share a trend. Additionally, trade count is influenced by factors entirely exogenous to the index level itself, including exchange fee structures, algorithmic trading rule changes, options expiration calendars, and macroeconomic event clustering. The regression's linear form may also be a simplification; the scatter suggests some heteroscedasticity, with variance in trade count appearing larger at intermediate index levels than at extremes.
Actionable Insights and Further Investigation
Given the absence of Granger causality, practitioners should avoid using NASDAQ index levels as a leading signal for trade count forecasting, or vice versa. The relationship is better understood as a reflection of a shared market regime — calm, rising markets breed lower fragmentation in trading activity. For further investigation, it would be valuable to: (1) detrend both series and re-examine the correlation to isolate regime effects from the secular 2016 uptrend; (2) introduce VIX or realized volatility as a mediating variable, as volatility likely drives both lower index levels and higher trade counts simultaneously; (3) segment the data by market phases (January–February stress vs. the mid-year recovery vs. the post-election surge) to test whether the correlation holds uniformly across regimes; and (4) extend the analysis across multiple years to determine whether 2016's specific macro environment — characterized by a sharp early selloff and steady recovery — is responsible for the observed pattern or whether it is a durable structural feature of U.S. equity market microstructure.
X dataset: Cboe U.S. Equities Historical Market Volume Data 2016
Y dataset: NASDAQ Composite Index Daily (FRED)
Part of experiment: Daily - Cboe U.S. Equities Historical Market Volume Data 2016 vs NASDAQ Composite Index Daily (FRED)