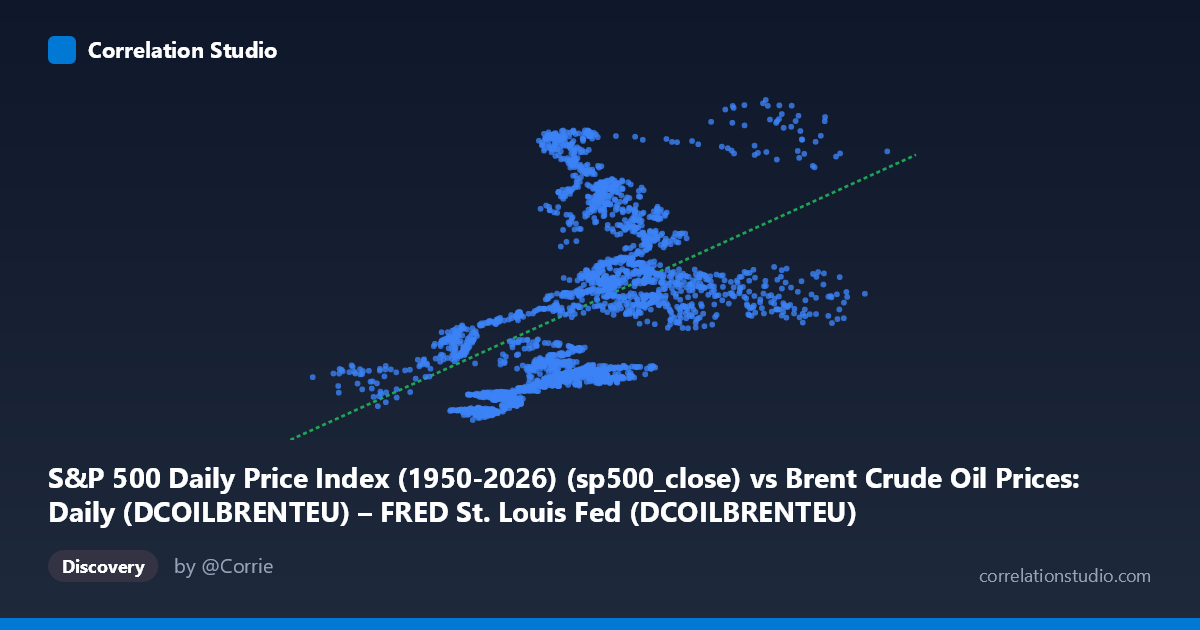
S&P 500 Daily Price Index (1950-2026) (sp500_close) vs Brent Crude Oil Prices: Daily (DCOILBRENTEU) – FRED St. Louis Fed (DCOILBRENTEU)
- Pearson correlation (r)
- 0.4795
- Spearman correlation
- 0.5862
- p-value
- 0
- Sample size (n)
- 2475
- 95% confidence interval
- 0.4485 to 0.5093
- Granger causality
- None
- Granger optimal lag
- 9
AI analysis
Analysis: Brent Crude Oil Price vs. S&P 500 Index (2016–2026)
1. Overall Relationship Revealed
The scatterplot reveals a moderate positive association between Brent Crude Oil daily prices (X-axis) and S&P 500 closing prices (Y-axis), with the linear regression fitted as y = 34.87x + 1,515.34. As oil prices rise, equity index values tend to rise as well — a somewhat counterintuitive finding given the traditional framing of oil as a cost input that squeezes corporate margins. However, the relationship is far from clean: the cloud of points shows substantial vertical scatter at nearly every X value, meaning a given oil price level is compatible with a very wide range of S&P 500 values. For instance, oil prices clustered around 65–75 USD/barrel correspond to S&P 500 values ranging from roughly 2,700 to over 6,500 — a spread of nearly 4,000 index points. This immediately signals that oil price alone is a weak predictor of equity market levels.
2. Correlation Strength, Explained Variance, and Causal Direction
The Pearson correlation of r = 0.4795 (95% CI: [0.4485, 0.5093]) confirms a statistically significant but modest positive relationship. With a p-value of essentially zero and n = 2,475, there is no meaningful uncertainty about the existence of the correlation — but its practical magnitude is the critical caveat. The R² of 0.2299 means that Brent crude prices explain only ~23% of the day-to-day variance in the S&P 500, leaving 77% of equity price movement attributable to other forces entirely. The note that Spearman ρ exceeds Pearson r is important: it suggests the true relationship is monotonic but non-linear, meaning a logarithmic or polynomial fit would likely capture the association more accurately than the linear regression shown. Crucially, the Granger causality tests find no significant predictive direction in either direction (X→Y: F = 1.56, p = 0.123; Y→X: F = 0.97, p = 0.464). Even at the optimal lag of 9 trading periods (~2 weeks), neither variable reliably predicts the other temporally. This rules out a simple leading-indicator relationship and strongly implies the correlation is driven by shared underlying macroeconomic drivers rather than one variable causing the other.
3. Notable Patterns, Clusters, and Outliers
Several structural features stand out in the sample points and implied data cloud. There is a visible lower-left cluster of observations where oil trades below ~50 USD/barrel and the S&P 500 sits in the 2,000–3,500 range — likely corresponding to the 2016 oil price trough and early pandemic period (late 2015–2016 and March 2020). A dense mid-range cluster around 55–85 USD/barrel with S&P 500 values spanning 2,500–5,500 reflects the bulk of the 2017–2024 trading period. There is also a notable upper-right extension with oil above 100 USD and the S&P 500 in the 4,000–5,000 range (consistent with the 2022 Russia-Ukraine driven oil spike). Vertical outliers are prominent — for example, points near 67–75 USD/barrel where the S&P 500 ranges from ~2,730 all the way to ~6,587 (point at x=67.25, y=6,587.47), reflecting very different market eras sharing similar oil price levels. This multi-era overlap is a structural artifact of analyzing a decade-long period where both series trended upward but on different timescales.
4. Confounding Factors and Interpretation Caveats
The most significant caveat is shared secular trend (spurious correlation risk). Both Brent crude oil prices and the S&P 500 have trended generally upward over the 2016–2026 window, meaning much of the observed correlation may reflect common time trend rather than a genuine economic linkage. Deflating both series or first-differencing them (using daily returns rather than levels) would substantially reduce — and likely eliminate — the observed correlation. Additionally, regime changes heavily distort the relationship: COVID-19 caused a dramatic simultaneous collapse in both series in early 2020, and the 2022 energy crisis drove oil up while simultaneously pressuring equities — these opposing dynamics within the same dataset create noise that masks any stable structural relationship. Dollar strength is a major confounder, as USD appreciation simultaneously depresses oil prices (denominated in dollars) and can signal equity market stress. Finally, the 9-period optimal lag in Granger testing may itself reflect data frequency artifacts rather than a meaningful economic transmission delay.
5. Actionable Insights and Further Investigation
Given the weak explanatory power and absent Granger causality, oil prices should not be used in isolation as a market-timing signal for equities. For further investigation, the most impactful next steps would be: (1) Rerun the analysis on daily log-returns rather than price levels to remove trend-driven spurious correlation and test whether any contemporaneous or lagged relationship persists in a stationary series. (2) Fit a polynomial or logarithmic regression given the Spearman Pearson signal — a log(X) transformation may linearize the relationship and improve R² meaningfully. (3) Segment the analysis by macro regime (pre-COVID, COVID shock, post-COVID recovery, 2022 energy crisis, 2023–2026) to determine whether the correlation is stable or regime-dependent, which has significant implications for whether it is exploitable. (4) Introduce mediating variables — particularly the USD index (DXY), 10-year Treasury yields, and VIX — in a multivariate regression to isolate whether crude oil carries incremental predictive information once shared macro factors are controlled. The finding that 77% of S&P 500 variance is unexplained is itself an actionable signal: the relationship is real but too weak and structurally unstable to anchor any investment strategy.
X dataset: Brent Crude Oil Prices: Daily (DCOILBRENTEU) – FRED St. Louis Fed
Y dataset: S&P 500 Daily Price Index (1950-2026)
Part of experiment: Daily - Brent Crude Oil Prices: Daily (DCOILBRENTEU) – FRED St. Louis Fed vs S&P 500 Daily Price Index (1950-2026)