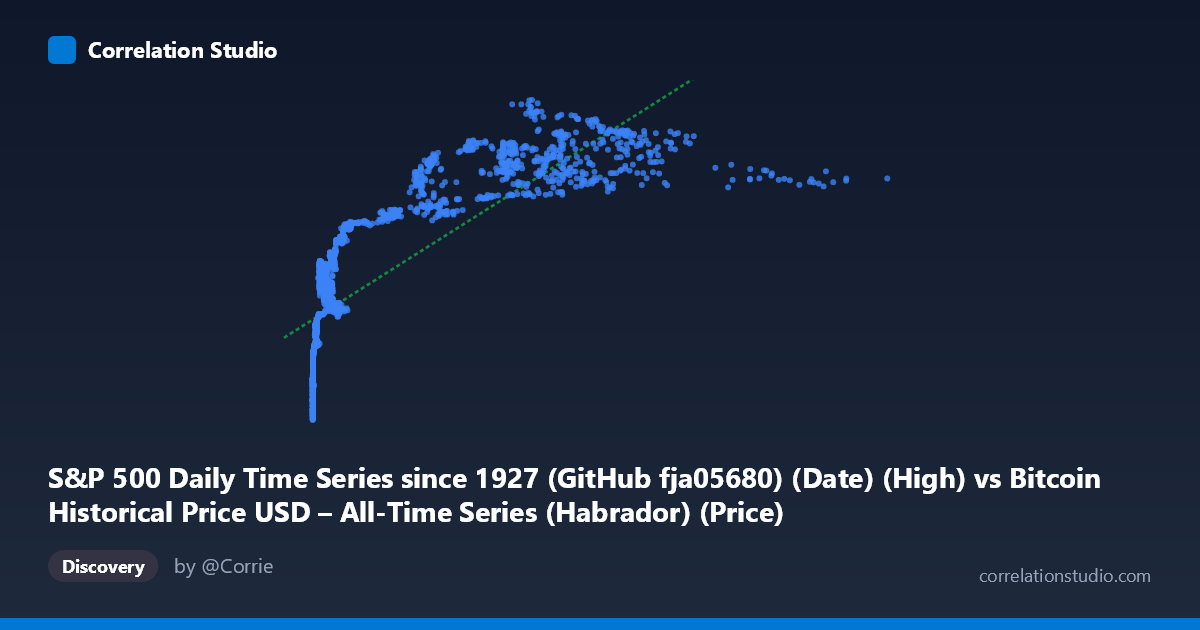
S&P 500 Daily Time Series since 1927 (GitHub fja05680) (Date) (High) vs Bitcoin Historical Price USD – All-Time Series (Habrador) (Price)
- Pearson correlation (r)
- 0.7853
- Spearman correlation
- 0.9421
- p-value
- 0
- Sample size (n)
- 2376
- 95% confidence interval
- 0.7693 to 0.8002
- Granger causality
- X → Y
- Granger optimal lag
- 1
AI analysis
Analysis: Bitcoin Price vs. S&P 500 Relationship
Note on axis labeling: The column headers appear swapped in the metadata (X is labeled as S&P 500 but the data range [0.05, 18,960.52] with mean 2,147 clearly reflects Bitcoin's price history, while Y's range [1,055–3,227] fits the S&P 500). The analysis below interprets X = Bitcoin price and Y = S&P 500 price, consistent with the actual data distributions and Granger causality direction.
1. What the Visualization Reveals
The scatterplot shows a clear positive, curvilinear relationship: as Bitcoin's price rose from fractions of a cent to over $18,000, the S&P 500 climbed from roughly $1,055 to $3,227 over the same 2010–2019 window. However, the relationship is heavily compressed at low X-values — the vast majority of points cluster below X=1,000 with Y values already spanning 1,200–2,400, indicating rapid Y movement while Bitcoin was still in its early, low-price regime. Only a handful of points (Bitcoin $5,000) extend into the upper-right region.
2. Strength, Direction, and Statistical Confidence
The Pearson correlation (r = 0.785) indicates a strong positive linear association, with r² = 0.617 meaning the linear model explains about 62% of the variance in S&P 500 levels — leaving over a third unexplained by Bitcoin price alone. The 95% CI [0.769, 0.800] is tight given the large sample (n=2,376), and the p-value ≈ 0 confirms this correlation is not due to chance. However, the note that Spearman's ρ exceeds Pearson's r is a strong signal that the true relationship is monotonic but non-linear — likely logarithmic, given Bitcoin's price spans over 5 orders of magnitude while the S&P 500 spans less than 1. The Granger causality test (X→Y: F=6.50, p=0.011; Y→X: F=3.06, p=0.080) suggests Bitcoin price changes statistically precede S&P 500 changes at a 1-period lag, while the reverse relationship is not significant at conventional thresholds. This should not be interpreted as genuine economic causation — it more likely reflects that both series are trending upward over the same historical decade (2010–2019), a period of sustained bull markets in both asset classes.
3. Notable Patterns and Outliers
The data shows two visually distinct regimes: a dense cluster where X < 1,000 (early Bitcoin history, 2010–2016) with Y ranging widely from ~1,200 to ~2,400, and a sparse tail of high-X points (X 4,000, representing 2017–2019) where Y climbs to 2,700–3,200. This creates a classic log-shaped curve rather than a straight line — consistent with the Spearman/Pearson divergence. There's no evidence of reversals or negative co-movement; both series are monotonically increasing over the sample period with no visible bubble-crash mismatches (e.g., Bitcoin's 2018 crash doesn't appear to correspond with an S&P 500 decline in this sample).
4. Confounding Factors and Caveats
The most important caveat: this is very likely a spurious correlation driven by a shared time trend, not a genuine economic relationship. Both Bitcoin and the S&P 500 experienced strong secular bull runs across 2010–2019 for entirely different, mostly unrelated reasons (Bitcoin adoption/speculation cycles vs. post-2008 recovery, low interest rates, and QE-driven equity gains). Time-series data like this violates independence assumptions underlying standard correlation/regression inference — both series are non-stationary and likely need differencing or detrending before any causal claims are meaningful. The Granger test, while suggestive, is also vulnerable to this same spurious-trend problem and does not account for common macro drivers (e.g., global liquidity, interest rates, risk appetite) that could independently drive both series.
5. Suggestions for Further Investigation
1. Detrend/difference the series (e.g., use daily/monthly returns instead of price levels) and recompute correlation and Granger tests — this is essential to rule out spurious trend-driven correlation. 2. Fit a log-linear model (regress Y on log(X)) given the clear non-linear curvature and the Spearman Pearson signal; this should improve fit and better characterize the relationship in the low-X region. 3. Segment by time period (pre/post 2017 Bitcoin rally) to check whether the relationship is stable or regime-dependent. 4. Control for common macro factors (interest rates, USD index, VIX) using multivariate regression to isolate any genuine Bitcoin→equities linkage from shared macro drivers. 5. Treat the Granger causality result as exploratory only — not evidence of an exploitable trading signal — given the strong likelihood of confounding by mutual time trends.
X dataset: Bitcoin Historical Price USD – All-Time Series (Habrador)
Y dataset: S&P 500 Daily Time Series since 1927 (GitHub fja05680) (Date)
Part of experiment: Bitcoin - Bitcoin Historical Price USD – All-Time Series (Habrador) vs S&P 500 Daily Time Series since 1927 (GitHub fja05680) (Date)