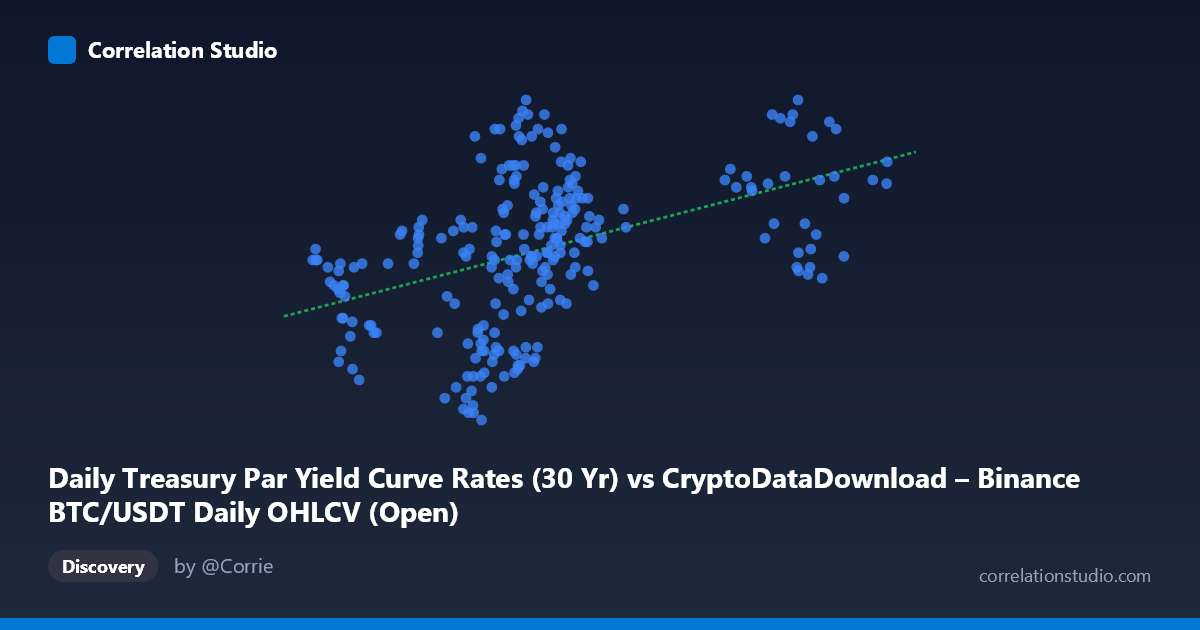
Daily Treasury Par Yield Curve Rates (30 Yr) vs CryptoDataDownload – Binance BTC/USDT Daily OHLCV (Open)
- Pearson correlation (r)
- 0.44
- Spearman correlation
- 0.515
- p-value
- 0
- Sample size (n)
- 250
- 95% confidence interval
- 0.3342 to 0.5349
- Granger causality
- None
- Granger optimal lag
- 1
- Time coverage
- 2024-01-02 to 2024-12-31
AI analysis
Analysis: Treasury 30-Year Yield vs. BTC/USDT Price Relationship
Note on axis labeling: The metadata appears mismatched — the X-axis is described as "30 Yr Treasury Par Yield" but the actual values (39,568–106,133) are clearly BTC/USDT price data, while Y-axis values (3.94–4.82) are clearly the 30-year Treasury yield percentages. This analysis proceeds using the actual data ranges: X = BTC price, Y = 30-year Treasury yield.
1. What the Visualization Reveals
The scatterplot shows a moderate positive relationship between Bitcoin price and the 30-year Treasury yield across 2024. As BTC price rises from roughly $40K to $106K, Treasury yields tend to drift upward from the high-3% range toward the high-4% range, though with substantial scatter at every price level. The relationship is far from deterministic — a wide vertical spread of yield values (roughly 4.0–4.7%) exists even within tight BTC price bands (e.g., $60K–$70K, where most points cluster).
2. Strength, Direction, and Statistical Confidence
The correlation coefficient (r = 0.44) indicates a moderate positive linear relationship, but r² = 0.194 shows that BTC price explains under 20% of the variance in the 30-year yield — the remaining 80%+ is driven by other factors (Fed policy, inflation expectations, fiscal issuance, macro data releases, etc.). The 95% CI [0.334, 0.535] is reasonably tight and entirely positive, and the p-value (2.9×10⁻¹³) confirms this correlation is highly unlikely to be due to chance. However, statistical significance with n=250 does not imply practical predictive power — the r² ceiling matters more here. Critically, Granger causality tests show no significant predictive direction in either direction (X→Y: p=0.296; Y→X: p=0.104). This means neither series reliably leads the other in a time-series sense at lag 1; the correlation likely reflects shared exposure to a common macro driver (e.g., risk sentiment, real rates, liquidity conditions) rather than one causing the other.
3. Notable Patterns and Outliers
The data shows a dense cluster of points between $55K–$70K BTC price and 4.0–4.7% yield, representing the bulk of the year's trading range. A secondary cluster appears at higher BTC prices ($90K–$106K, likely late-2024 rally) paired with yields mostly in the 4.4–4.8% range — consistent with both assets rising together late in the year. Lower BTC prices ($40K–$50K, early 2024) correspond to more varied yields (4.1–4.4%), suggesting the relationship may not be stable across the full period — it could be driven disproportionately by a specific sub-period (e.g., Q4) rather than a consistent year-round dynamic. No extreme outliers are evident; the scatter is fairly continuous.
4. Confounding Factors and Caveats
This is a classic case of spurious or confounded correlation risk: both BTC price and long-term Treasury yields trended upward over 2024 due to unrelated or loosely related macro narratives (risk-on sentiment, Fed rate expectations, election outcomes, fiscal deficit concerns). Time-trending series often show artificial correlation simply because both are non-stationary and drifting in the same direction over the sample window — this is a strong candidate here given the lack of Granger causality. Additionally, daily OHLCV crypto data and daily Treasury par yields have different market microstructures (24/7 vs. business-day trading), and any lagged alignment or interpolation could distort the relationship.
5. Suggestions for Further Investigation
Given the trending-series concern, analysts should test for and correct non-stationarity (e.g., using differenced or de-trended series, or an Augmented Dickey-Fuller test) before drawing causal or predictive conclusions — the raw r=0.44 may largely reflect a shared time trend. It would also help to segment the analysis by quarter to check whether the correlation is stable or concentrated in specific periods (e.g., post-election Q4 2024). Finally, since Granger causality found no lead-lag relationship at lag 1, testing longer lags (5, 10, 20 days) or including a third variable (e.g., DXY, Fed funds rate, or equity risk sentiment) as a control would help clarify whether this is a genuine economic linkage or a coincidental co-trend.
X dataset: CryptoDataDownload – Binance BTC/USDT Daily OHLCV
Y dataset: Daily Treasury Par Yield Curve Rates
Part of experiment: Bitcoin - CryptoDataDownload – Binance BTC/USDT Daily OHLCV vs Daily Treasury Par Yield Curve Rates