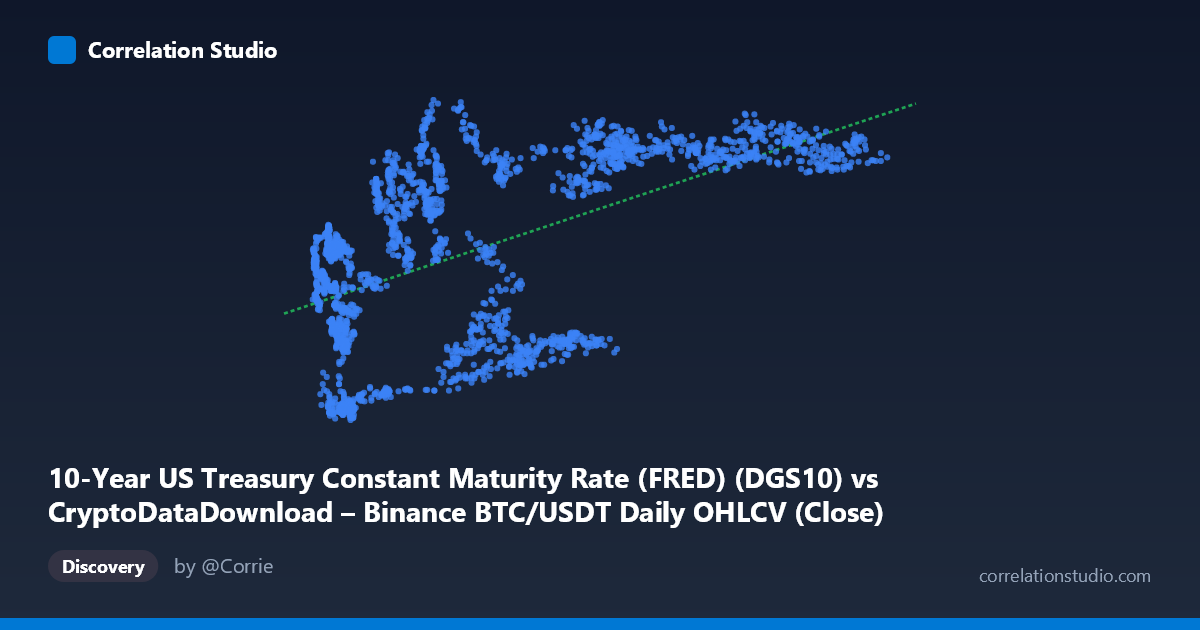
10-Year US Treasury Constant Maturity Rate (FRED) (DGS10) vs CryptoDataDownload – Binance BTC/USDT Daily OHLCV (Close)
- Pearson correlation (r)
- 0.5709
- Spearman correlation
- 0.5454
- p-value
- 0
- Sample size (n)
- 2197
- 95% confidence interval
- 0.542 to 0.5985
- Granger causality
- None
- Granger optimal lag
- 1
- Time coverage
- 2017-08-17 to 2026-06-25
- Recomputed on refreshed data
- 2026-10-23 (r was 0.5709)
AI analysis
Analysis: BTC/USDT Price vs. 10-Year Treasury Yield
Note on axis labeling: The metadata appears swapped — the X-axis (values 3,189–124,658) is clearly BTC/USDT closing price, while the Y-axis (values 0.52–4.98) is clearly the 10-Year Treasury yield in percent. The analysis below treats the data accordingly.
1. What the Visualization Shows
The scatterplot displays a moderate positive relationship: as Bitcoin's price rises, the 10-year Treasury yield also tends to be higher. Low BTC prices (under ~$20,000) are associated almost exclusively with yields below 2%, while high BTC prices (above $80,000) cluster tightly in the 4.0–4.7% yield range. The middle price range ($20,000–$60,000) shows the widest scatter, with yields ranging from ~1.3% to ~4.3% at similar price levels — indicating this is where the relationship is least reliable.
2. Strength, Direction, and Statistical Confidence
The correlation (r = 0.568) is moderate-positive, with r² = 0.323 indicating that only about 32% of the variance in Treasury yields is explained by BTC price (or vice versa) in a simple linear sense — leaving roughly two-thirds of the variance driven by other factors. The 95% CI [0.539, 0.596] is fairly tight given the large sample (n=2,183), and the p-value ≈ 0 confirms the correlation is highly unlikely to be due to chance. However, statistical significance here reflects a real historical co-movement, not necessarily a causal or tradeable relationship.
Critically, the Granger causality tests show no significant predictive direction in either direction (X→Y: p=0.137; Y→X: p=0.615). This means neither BTC price nor Treasury yields reliably help forecast the other's near-term movements once past values of each series are accounted for. This strongly suggests the correlation is driven by both variables independently trending over the same historical period (2017–2026) rather than one causally driving the other.
3. Patterns, Clusters, and Non-linearity
The relationship is clearly non-linear/regime-like rather than a smooth linear trend: - A dense low-price/low-yield cluster (BTC < $20K, yield < 2%) — largely reflecting 2020–2021 near-zero rate era. - A dispersed middle zone ($20K–$70K) with high yield variance — reflecting the 2022–2023 rate-hiking cycle overlapping with volatile BTC prices. - A high-price/high-yield cluster (BTC $80K, yield ~4–4.7%) — reflecting 2024–2025 conditions.
This looks more like a step function tied to macro eras than a continuous causal relationship — both series independently rose over the sampled timeframe.
4. Confounding Factors and Caveats
- Time confound (spurious trend correlation): Both BTC price and 10Y yields have trended upward over 2017–2026 for entirely different reasons (crypto adoption/halving cycles vs. Fed tightening/inflation). Two unrelated upward-trending time series will show correlation without causation. - Non-stationarity: Neither series is likely stationary; regressing one on the other without differencing/detrending can inflate r² artificially (spurious regression problem). - Missing macro variables: Inflation, Fed policy, risk sentiment, and liquidity conditions likely drive both series simultaneously (common-cause confounding). - Granger test caveat: Only 1 lag was tested; longer-lag relationships or regime-dependent causality could be missed.
5. Recommendations for Further Investigation
- Detrend or difference both series (e.g., use daily/weekly returns instead of levels) and re-run correlation and Granger tests to check if the relationship survives — this is essential given the non-stationarity concern. - Segment by macro regime (zero-rate era vs. hiking cycle vs. current) to see if the relationship is regime-specific rather than universal. - Introduce control variables like inflation (CPI), Fed funds rate changes, or equity market indices (S&P 500) to test for confounding. - Avoid using this correlation for trading/forecasting given the null Granger causality result — there's no evidence one series leads the other in a predictive sense.
X dataset: CryptoDataDownload – Binance BTC/USDT Daily OHLCV
Y dataset: 10-Year US Treasury Constant Maturity Rate (FRED)
Part of experiment: Bitcoin - CryptoDataDownload – Binance BTC/USDT Daily OHLCV vs 10-Year US Treasury Constant Maturity Rate (FRED)