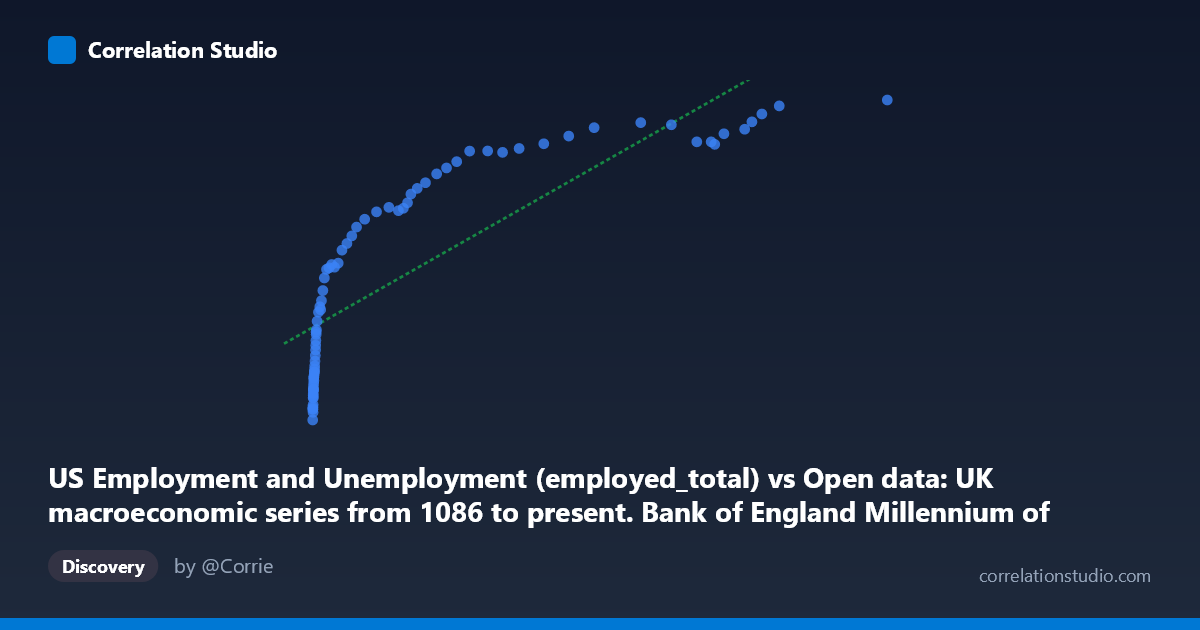
US Employment and Unemployment (employed_total) vs Open data: UK macroeconomic series from 1086 to present. Bank of England Millennium of Macroeconomic Data. (Month) (value)
- Pearson correlation (r)
- 0.8241
- Spearman correlation
- 0.997
- p-value
- 0
- Sample size (n)
- 77
- 95% confidence interval
- 0.7359 to 0.8848
- Granger causality
- None
- Granger optimal lag
- 10
- Time coverage
- 1941-01-01 to 2017-01-01
AI analysis
Analysis of US Total Employment vs. UK Macroeconomic Index (1941–2017)
1. What the Visualization Reveals
The scatterplot displays a positive, broadly upward-trending relationship between US total employment (X-axis, in thousands) and a UK macroeconomic index value (Y-axis), spanning 76 years of annual observations. The data points sweep from the lower-left corner — where low US employment figures correspond to lower UK index values (~50,000–65,000) — toward the upper-right, where high US employment levels align with elevated UK index readings (~140,000–153,000). However, the relationship is clearly not linear across its full range: the lower end of the X-axis shows tightly clustered points with steep Y-variation relative to small X-changes, while the upper end flattens considerably, suggesting a logarithmic or diminishing-returns curve rather than a straight line.
2. Correlation Strength, Direction, and Statistical Framing
The Pearson correlation of r = 0.824 indicates a strong positive association, and the R² of 0.679 means that approximately 68% of the variance in the UK index is statistically explained by US employment levels — a meaningful but incomplete picture, leaving roughly one-third of variation unexplained by this pairing alone. The 95% confidence interval of [0.736, 0.885] is relatively narrow and sits well above zero, reflecting genuine statistical reliability across the sample. The p-value of essentially zero confirms the association is not a chance artifact at any conventional significance threshold. Critically, however, the Granger causality tests are non-significant in both directions (X→Y: F=1.40, p=0.21; Y→X: F=1.44, p=0.19), meaning neither series demonstrably predicts the other temporally with a 10-period lag. This is an important caveat: statistical correlation exists, but no temporal predictive relationship can be established, strongly implying that both series are driven by shared underlying forces rather than one causing the other.
3. Notable Patterns, Clusters, and Non-Linear Features
The most visually striking feature is the dense cluster of points at low X values (roughly 164–2,000), where Y spans from ~50,000 to ~95,000 — a wide vertical spread relative to a narrow horizontal range. This compression at the left tail is the clearest signal of non-linearity, and the note that Spearman ρ exceeds Pearson r confirms this formally: a rank-based measure outperforming a linear one indicates the true functional form is curved. The upper range (X 40,000) shows points that are more linearly dispersed but with visibly reduced slope, consistent with a logarithmic saturation effect. There are no dramatic outliers per se, but the extreme upper-right observations (X ~83,000–116,000; Y ~139,000–153,000) form a loose cluster where Y appears to plateau, suggesting diminishing marginal association at high employment levels.
4. Confounding Factors and Interpretation Caveats
The most fundamental caveat here is that both series are non-stationary time trends — US employment has grown steadily since 1941 due to population growth, labor force expansion, and economic development, while the UK macroeconomic index (likely nominal GDP, wages, or a price-level series given its scale) has similarly trended upward over decades. This means the observed correlation may be largely or entirely spurious, driven by the shared temporal trend rather than any genuine economic linkage between US labor markets and UK macroeconomic conditions. The Granger non-causality result reinforces this interpretation. Additionally, the datasets originate from different institutional sources and measurement frameworks (BLS US employment vs. Bank of England historical series), and the "UK macroeconomic value" label is ambiguous — without knowing precisely which UK series this represents, economic interpretation is limited. Cross-national correlations across 76 years also absorb major structural breaks (WWII, oil shocks, 2008 financial crisis) that would differentially affect both series.
5. Actionable Insights and Further Investigation
Given the evidence of non-linearity, the immediate analytical recommendation is to refit using a logarithmic or power-law model (e.g., Y = a·ln(X) + b), which would likely produce a substantially higher R² and more theoretically defensible residuals. More importantly, both series should be differenced or detrended (e.g., using first differences or HP-filter decomposition) before drawing any causal inferences — the raw correlation almost certainly inflates the true relationship by conflating it with shared secular trends. It would also be valuable to identify precisely which Bank of England series is being used, as the interpretation differs vastly between nominal GDP, wage indices, or price levels. Finally, introducing control variables — such as global trade volumes, oil prices, or synchronized business cycle indicators — and performing cointegration analysis (rather than Granger causality on levels) would help determine whether any genuine long-run economic relationship exists between US labor market conditions and UK macroeconomic performance across this historical period.
X dataset: Open data: UK macroeconomic series from 1086 to present. Bank of England Millennium of Macroeconomic Data. (Month)
Y dataset: US Employment and Unemployment
Part of experiment: Yearly - Open data: UK macroeconomic series from 1086 to present. Bank of England Millennium of Macroeconomic Data. (Month) vs US Employment and Unemployment