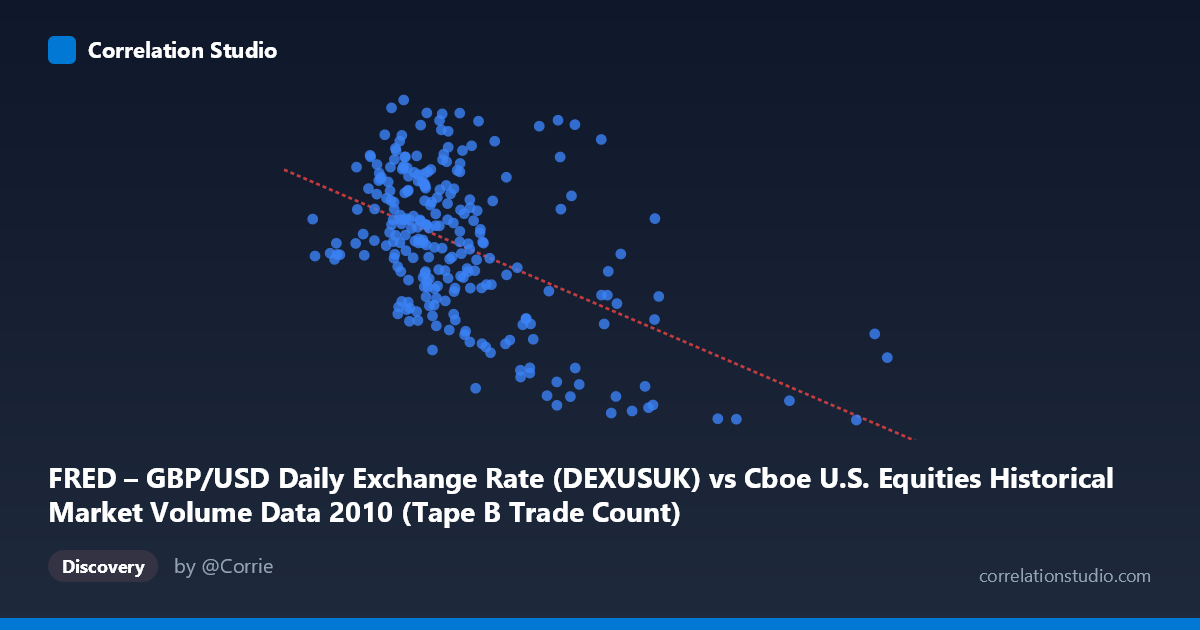
FRED – GBP/USD Daily Exchange Rate (DEXUSUK) vs Cboe U.S. Equities Historical Market Volume Data 2010 (Tape B Trade Count)
- Pearson correlation (r)
- -0.5113
- Spearman correlation
- -0.4244
- p-value
- 0
- Sample size (n)
- 249
- 95% confidence interval
- -0.5977 to -0.4133
- Granger causality
- None
- Granger optimal lag
- 1
AI analysis
Scatterplot Analysis: GBP/USD Exchange Rate vs. Cboe Tape B Trade Count (2010)
Relationship Overview The scatterplot reveals a negative relationship between Cboe U.S. Equities Tape B trade counts (X-axis) and the GBP/USD daily exchange rate (Y-axis) across 2010. As equity market trade volume increases, the pound tends to trade at a lower value against the dollar. The linear regression equation (y = -1.90×10⁻⁷x + 1.603) confirms this downward slope, suggesting that for every one million additional trades, the GBP/USD rate falls by approximately 0.19 pips — a modest but consistent directional signal. The data cloud, while scattered, shows a discernible downward drift from left to right, particularly visible in the clustering of high-volume days (450,000 trades) coinciding with exchange rates below 1.50.
Correlation Strength and Statistical Framing The Pearson correlation of r = -0.511 indicates a moderate negative association, with r² = 0.261 meaning that only 26.1% of the variance in GBP/USD is explained by Tape B trade volume — leaving nearly three-quarters of daily exchange rate variation attributable to other factors. The 95% confidence interval of [-0.598, -0.413] is meaningfully narrow and does not cross zero, and the p-value of effectively 0 (against N = 3,302) confirms this is statistically robust and unlikely to be a sampling artifact. However, statistical significance here benefits substantially from the large population size, so practical significance deserves more scrutiny. Critically, the Granger causality tests are non-significant in both directions (X→Y: F = 0.70, p = 0.40; Y→X: F = 1.94, p = 0.17), meaning neither variable demonstrably predicts the other temporally at a one-period lag. This rules out a straightforward leading-indicator relationship and counsels against any causal interpretation.
Patterns, Clusters, and Outliers The data exhibits notable heterogeneity across the X range. The bulk of observations cluster between approximately 180,000–400,000 trades, where GBP/USD spans a wide range from ~1.48 to 1.64 — suggesting that at moderate volume levels, the exchange rate is highly variable and poorly constrained by volume alone. However, high-volume outliers (500,000 trades, including points near 576K, 585K, and 675K) almost uniformly appear at lower exchange rates (1.43–1.56), anchoring the negative slope. A particularly notable outlier at roughly (675,000, 1.44) sits well to the right and low, consistent with the broader trend but exerting disproportionate leverage on the regression fit. The upper-left region (low volume, high GBP/USD ~1.59–1.64) suggests early-2010 dynamics when sterling was stronger and markets less active.
Confounding Factors and Caveats Several important caveats limit causal interpretation. First, 2010 was a distinctive macro-financial year: the Eurozone sovereign debt crisis intensified through spring and summer, simultaneously driving risk-off flows into the dollar (depressing GBP/USD) and elevating U.S. equity market activity as volatility spiked — creating a spurious correlation through a common third driver (global risk sentiment). Second, the axis labels appear transposed relative to the dataset descriptions (X is labeled as GBP/USD but described as trade count, and vice versa), which warrants verification before drawing firm conclusions. Third, Tape B specifically covers NYSE American and regional exchanges, making it a partial proxy for overall market activity. Finally, daily aggregation masks intraday dynamics where the relationship may behave very differently.
Actionable Insights and Further Investigation Given the moderate correlation, non-trivial unexplained variance, and absent Granger causality, practitioners should not use Tape B volume alone as a GBP/USD trading signal. However, the consistent pattern at high-volume extremes warrants further decomposition: isolating high-volatility days (e.g., VIX spikes) may reveal whether the correlation is driven by specific stress regimes rather than a general structural link. Researchers should incorporate a risk-sentiment proxy (VIX, credit spreads, or TED spread) as a control variable to test whether the correlation survives. Extending the analysis to multiple years would test whether this pattern is 2010-specific or more durable. Finally, testing nonlinear models (e.g., threshold regression distinguishing high- vs. low-volume regimes) may capture the apparent clustering behavior more accurately than the current linear specification.
X dataset: Cboe U.S. Equities Historical Market Volume Data 2010
Y dataset: FRED – GBP/USD Daily Exchange Rate
Part of experiment: Daily - Cboe U.S. Equities Historical Market Volume Data 2010 vs FRED – GBP/USD Daily Exchange Rate