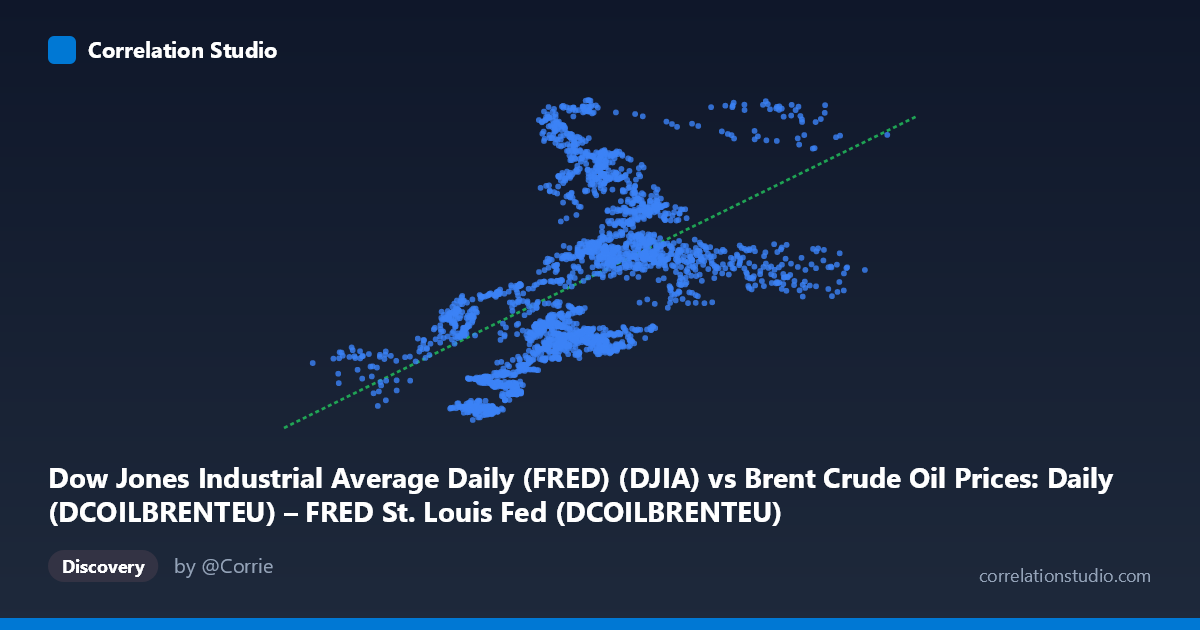
Dow Jones Industrial Average Daily (FRED) (DJIA) vs Brent Crude Oil Prices: Daily (DCOILBRENTEU) – FRED St. Louis Fed (DCOILBRENTEU)
- Pearson correlation (r)
- 0.5183
- Spearman correlation
- 0.5957
- p-value
- 0
- Sample size (n)
- 2471
- 95% confidence interval
- 0.4888 to 0.5465
- Granger causality
- None
- Granger optimal lag
- 10
AI analysis
Dow Jones Industrial Average vs. Brent Crude Oil Prices: Correlation Analysis
Relationship Overview
The scatterplot reveals a moderate positive relationship between the Dow Jones Industrial Average (DJIA) and Brent Crude Oil prices over the period spanning May 2016 to May 2026. As DJIA values increase (X-axis, ranging from roughly 9 to 138 USD/barrel), Brent Crude prices (Y-axis, ranging from ~$17,140 to ~$50,188) tend to rise as well. The linear regression equation y = 226.43x + 15,715.6 suggests that for every one-unit increase in the DJIA, Brent Crude is associated with an approximate $226 increase — though this directional framing is complicated by the axis labeling, which appears inverted from the conventional expectation (oil prices on X, equity index on Y). The overall trend is upward but with substantial scatter, indicating the relationship is real but far from deterministic.
Correlation Strength and Statistical Significance
The Pearson correlation of r = 0.5183 indicates a moderate positive association, but the explanatory power is notably limited: r² = 0.2686 means only ~26.9% of the variance in DJIA is explained by Brent Crude prices (or vice versa), leaving roughly 73% attributable to other factors. The 95% confidence interval of [0.4888, 0.5465] is relatively tight given the large sample (n = 2,471), and the p-value of essentially zero confirms this correlation is highly statistically significant — not a sampling artifact. However, statistical significance here is partly a function of the very large sample size, so practical significance must be evaluated separately. Critically, the Granger causality analysis finds no significant predictive direction in either direction (X→Y: F = 1.48, p = 0.14; Y→X: F = 0.92, p = 0.52), meaning that past values of oil prices do not meaningfully predict future DJIA movements, and vice versa, at the tested lag of 10 periods. This strongly tempers any causal interpretation of the correlation.
Notable Patterns, Clusters, and Outliers
Several structural features stand out in the sample points. There is a dense cluster in the mid-range (X: 50–90, Y: $25,000–$36,000), suggesting most observations fall within a "normal market regime." However, there are notable high-Y outliers — points like (111.86, $49,230), (65.01, $47,632), and (61.23, $46,190) — where DJIA reached elevated levels at relatively modest or mid-range oil prices, hinting at non-linearity or regime shifts (e.g., post-COVID equity rallies decoupled from oil). Conversely, low-Y values such as (46.69, $17,400) and (49.29, $18,098) likely correspond to the COVID-era market crash of 2020, when both oil and equities collapsed simultaneously. The wide vertical spread at any given X value (e.g., at X ≈ 70, Y ranges from ~$25,000 to ~$42,000) visually confirms the modest explanatory power of the linear model.
Confounding Factors and Caveats
This correlation almost certainly reflects common underlying macroeconomic drivers rather than a direct causal mechanism between oil prices and equity markets. Both series are heavily influenced by global economic growth cycles, Federal Reserve monetary policy, geopolitical risk events (e.g., Russia-Ukraine conflict, OPEC decisions), and pandemic-era disruptions — all of which can move oil and equities in the same direction simultaneously. The axis labeling in the dataset appears swapped (DJIA is listed as the X-axis source but described under the Y-axis label and vice versa), which warrants careful verification before drawing conclusions. Additionally, the long time window (2016–2026) spans multiple distinct economic regimes — pre-COVID expansion, the 2020 crash, unprecedented monetary stimulus, and post-pandemic inflation — making a single linear model potentially misleading across all periods.
Actionable Insights and Further Investigation
Given the moderate correlation but absent Granger causality, practitioners should avoid using oil prices as a short-term timing signal for equity positions (or vice versa). Instead, this relationship may be more useful as a regime indicator: persistent divergence between the two series could signal macroeconomic stress or sector rotation worth monitoring. Further investigation should include: (1) subsetting the data by economic regime (pre/during/post-COVID) to test whether the correlation is stable or regime-dependent; (2) testing non-linear models (polynomial or piecewise regression) given the visible heteroscedasticity; (3) introducing mediating variables such as USD index, global PMI, or Fed Funds Rate to partial out confounding; and (4) extending Granger causality testing across multiple lag structures to confirm the null result is robust. A rolling-window correlation analysis would also reveal whether the relationship has strengthened or weakened over time.
X dataset: Brent Crude Oil Prices: Daily (DCOILBRENTEU) – FRED St. Louis Fed
Y dataset: Dow Jones Industrial Average Daily (FRED)
Part of experiment: Daily - Brent Crude Oil Prices: Daily (DCOILBRENTEU) – FRED St. Louis Fed vs Dow Jones Industrial Average Daily (FRED)